

354
R.W. Pearcy and W.A. Ptitsch
500
400
300
--.....
(J)
200
E
""--' 100
(f)
(f)
0
0
E
~ 500
1988
L
0
400
300
200
100
0
FEB MAR APR MAY JUN JUL AUG SEPT
Date
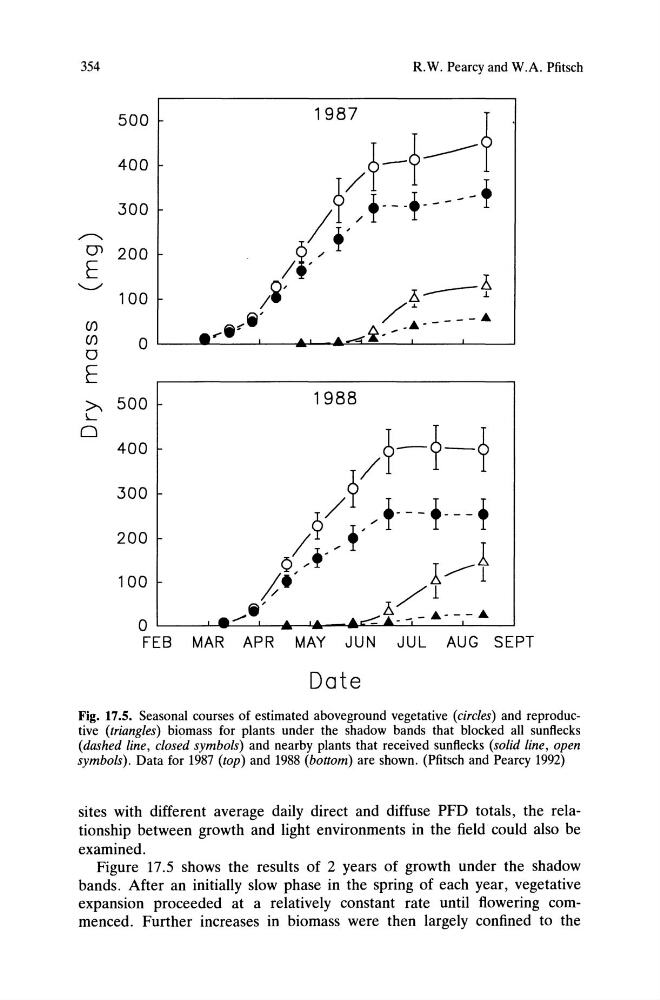
Fig. 17.5. Seasonal courses of estimated aboveground vegetative (circles) and reproductive (triangles) biomass for plants under the shadow bands that blocked all sunflecks
(dashed line, closed symbols) and nearby plants that received sunflecks (solid line, open
symbols). Data for 1987 (top) and 1988 (bottom) are shown. (Ptitsch and Pearcy 1992)
sites with different average daily direct and diffuse PFD totals, the relationship between growth and light environments in the field could also be
examined.
Figure 17.5 shows the results of 2 years of growth under the shadow
bands. After an initially slow phase in the spring of each year, vegetative
expansion proceeded at a relatively constant rate until flowering commenced. Further increases in biomass were then largely confined to the
R.W. Pearcy and W.A. Ptitsch
500
400
300
--.....
(J)
200
E
""--' 100
(f)
(f)
0
0
E
~ 500
1988
L
0
400
300
200
100
0
FEB MAR APR MAY JUN JUL AUG SEPT
Date
Fig. 17.5. Seasonal courses of estimated aboveground vegetative (circles) and reproductive (triangles) biomass for plants under the shadow bands that blocked all sunflecks
(dashed line, closed symbols) and nearby plants that received sunflecks (solid line, open
symbols). Data for 1987 (top) and 1988 (bottom) are shown. (Ptitsch and Pearcy 1992)
sites with different average daily direct and diffuse PFD totals, the relationship between growth and light environments in the field could also be
examined.
Figure 17.5 shows the results of 2 years of growth under the shadow
bands. After an initially slow phase in the spring of each year, vegetative
expansion proceeded at a relatively constant rate until flowering commenced. Further increases in biomass were then largely confined to the