

324
T.G.A. Green and O.L. Lange
the range of 100 to 200%, related to plant dry weight (Dilks and Proctor
1979; Kershaw 1985). Dilks and Proctor (1979) noted for bryophytes that,
where CO2 exchange is linearly related to thallus water content at low
hydration, both A and R respond similarly. The same situation seems to
apply in lichens. At higher thallus water content, R is normally fairly
constant although there has been a controversy over this point in lichens
that still needs to be adequately resolved (Lange and Matthes 1981; Kershaw
1985; Green et al. 1985). Response of R to increase in temperature has, as
expected, a 010 close to 2, at least for mosses (Longton 1988).
Lichen studies have often noted the high value of R relative to A. The
Photosynthetic Efficiency Coefficient [KF = (A + R)/R, Larcher 1984] for
lichens, at optimal thallus water content, is 2-4 (Snelgar et al. 1980) and is
low compared to the 10-20 of higher plant sun leaves (Larcher 1984). This
high R (relative to A) has been explained as being a consequence of the
high, nonphotosynthetic, fungal component of lichens (Lange and Kappen
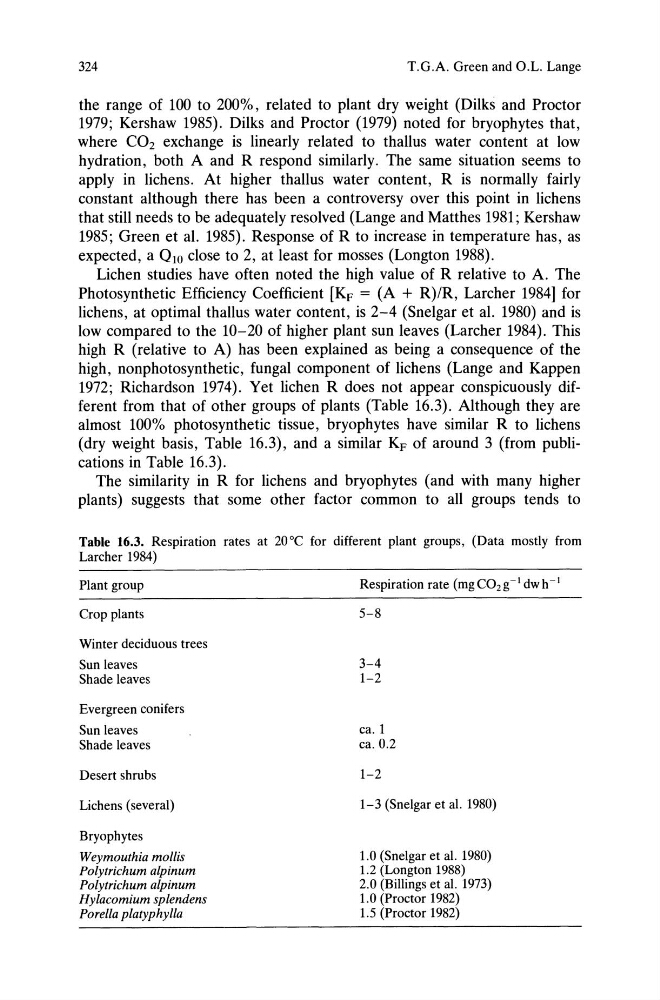
1972; Richardson 1974). Yet lichen R does not appear conspicuously different from that of other groups of plants (Table 16.3). Although they are
almost 100% photosynthetic tissue, bryophytes have similar R to lichens
(dry weight basis, Table 16.3), and a similar KF of around 3 (from publications in Table 16.3).
The similarity in R for lichens and bryophytes (and with many higher
plants) suggests that some other factor common to all groups tends to
Table 16.3. Respiration rates at 20°C for different plant groups, (Data mostly from
Larcher 1984)
Plant group
Crop plants
Winter deciduous trees
Sun leaves
Shade leaves
Evergreen conifers
Sun leaves
Shade leaves
Desert shrubs
Lichens (several)
Bryophytes
Weymouthia mollis
Polytrichum alpinum
Polytrichum alpinum
Hylacomium splendens
Porella platyphylla
Respiration rate (mg CO2 g -1 dw h- 1
5-8
3-4
1-2
ca. 1
ca. 0.2
1-2
1-3 (Snelgar et al. 1980)
1.0 (Snelgar et al. 1980)
1.2 (Longton 1988)
2.0 (Billings et al. 1973)
1.0 (Proctor 1982)
1.5 (Proctor 1982)
T.G.A. Green and O.L. Lange
the range of 100 to 200%, related to plant dry weight (Dilks and Proctor
1979; Kershaw 1985). Dilks and Proctor (1979) noted for bryophytes that,
where CO2 exchange is linearly related to thallus water content at low
hydration, both A and R respond similarly. The same situation seems to
apply in lichens. At higher thallus water content, R is normally fairly
constant although there has been a controversy over this point in lichens
that still needs to be adequately resolved (Lange and Matthes 1981; Kershaw
1985; Green et al. 1985). Response of R to increase in temperature has, as
expected, a 010 close to 2, at least for mosses (Longton 1988).
Lichen studies have often noted the high value of R relative to A. The
Photosynthetic Efficiency Coefficient [KF = (A + R)/R, Larcher 1984] for
lichens, at optimal thallus water content, is 2-4 (Snelgar et al. 1980) and is
low compared to the 10-20 of higher plant sun leaves (Larcher 1984). This
high R (relative to A) has been explained as being a consequence of the
high, nonphotosynthetic, fungal component of lichens (Lange and Kappen
1972; Richardson 1974). Yet lichen R does not appear conspicuously different from that of other groups of plants (Table 16.3). Although they are
almost 100% photosynthetic tissue, bryophytes have similar R to lichens
(dry weight basis, Table 16.3), and a similar KF of around 3 (from publications in Table 16.3).
The similarity in R for lichens and bryophytes (and with many higher
plants) suggests that some other factor common to all groups tends to
Table 16.3. Respiration rates at 20°C for different plant groups, (Data mostly from
Larcher 1984)
Plant group
Crop plants
Winter deciduous trees
Sun leaves
Shade leaves
Evergreen conifers
Sun leaves
Shade leaves
Desert shrubs
Lichens (several)
Bryophytes
Weymouthia mollis
Polytrichum alpinum
Polytrichum alpinum
Hylacomium splendens
Porella platyphylla
Respiration rate (mg CO2 g -1 dw h- 1
5-8
3-4
1-2
ca. 1
ca. 0.2
1-2
1-3 (Snelgar et al. 1980)
1.0 (Snelgar et al. 1980)
1.2 (Longton 1988)
2.0 (Billings et al. 1973)
1.0 (Proctor 1982)
1.5 (Proctor 1982)