

Apoplastic & Symplastic Proton Concentrations & Their Significance for Metabolism 105
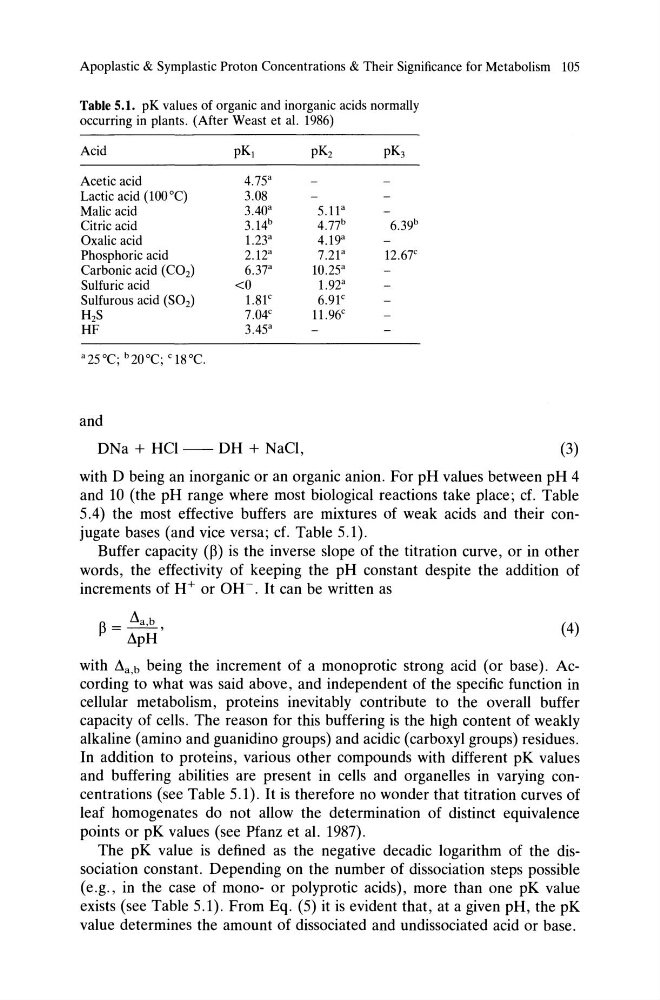
Table 5.1. pK values of organic and inorganic acids normally
occurring in plants. (After Weast et al. 1986)
Acid
Acetic acid
Lactic acid (100°C)
Malic acid
Citric acid
Oxalic acid
Phosphoric acid
Carbonic acid (C02)
Sulfuric acid
Sulfurous acid (S02)
H2S
HF
and
4.75 a
3.08
3.40 a
3.14 b
1.23 a
2.12a
6.37 a
<0
1.81 c
7.04 c
3.45"
DNa + Hel - - DH + NaCl,
5.11a
4.77 b
4.19 a
7.21a
10.25"
1.92 a
6.91c
11.96 c
12.67 c
(3)
with D being an inorganic or an organic anion. For pH values between pH 4
and 10 (the pH range where most biological reactions take place; cf. Table
5.4) the most effective buffers are mixtures of weak acids and their conjugate bases (and vice versa; cf. Table 5.1).
Buffer capacity (B) is the inverse slope of the titration curve, or in other
words, the effectivity of keeping the pH constant despite the addition of
increments of H+ or OH-. It can be written as
B = ~a.b ,
,1pH
(4)
with ,1a,b being the increment of a monoprotic strong acid (or base). According to what was said above, and independent of the specific function in
cellular metabolism, proteins inevitably contribute to the overall buffer
capacity of cells. The reason for this buffering is the high content of weakly
alkaline (amino and guanidino groups) and acidic (carboxyl groups) residues.
In addition to proteins, various other compounds with different pK values
and buffering abilities are present in cells and organelles in varying concentrations (see Table 5.1). It is therefore no wonder that titration curves of
leaf homogenates do not allow the determination of distinct equivalence
points or pK values (see Pfanz et al. 1987).
The pK value is defined as the negative decadic logarithm of the dissociation constant. Depending on the number of dissociation steps possible
(e.g., in the case of mono- or polyprotic acids), more than one pK value
exists (see Table 5.1). From Eq. (5) it is evident that, at a given pH, the pK
value determines the amount of dissociated and undissociated acid or base.
Table 5.1. pK values of organic and inorganic acids normally
occurring in plants. (After Weast et al. 1986)
Acid
Acetic acid
Lactic acid (100°C)
Malic acid
Citric acid
Oxalic acid
Phosphoric acid
Carbonic acid (C02)
Sulfuric acid
Sulfurous acid (S02)
H2S
HF
and
4.75 a
3.08
3.40 a
3.14 b
1.23 a
2.12a
6.37 a
<0
1.81 c
7.04 c
3.45"
DNa + Hel - - DH + NaCl,
5.11a
4.77 b
4.19 a
7.21a
10.25"
1.92 a
6.91c
11.96 c
12.67 c
(3)
with D being an inorganic or an organic anion. For pH values between pH 4
and 10 (the pH range where most biological reactions take place; cf. Table
5.4) the most effective buffers are mixtures of weak acids and their conjugate bases (and vice versa; cf. Table 5.1).
Buffer capacity (B) is the inverse slope of the titration curve, or in other
words, the effectivity of keeping the pH constant despite the addition of
increments of H+ or OH-. It can be written as
B = ~a.b ,
,1pH
(4)
with ,1a,b being the increment of a monoprotic strong acid (or base). According to what was said above, and independent of the specific function in
cellular metabolism, proteins inevitably contribute to the overall buffer
capacity of cells. The reason for this buffering is the high content of weakly
alkaline (amino and guanidino groups) and acidic (carboxyl groups) residues.
In addition to proteins, various other compounds with different pK values
and buffering abilities are present in cells and organelles in varying concentrations (see Table 5.1). It is therefore no wonder that titration curves of
leaf homogenates do not allow the determination of distinct equivalence
points or pK values (see Pfanz et al. 1987).
The pK value is defined as the negative decadic logarithm of the dissociation constant. Depending on the number of dissociation steps possible
(e.g., in the case of mono- or polyprotic acids), more than one pK value
exists (see Table 5.1). From Eq. (5) it is evident that, at a given pH, the pK
value determines the amount of dissociated and undissociated acid or base.