

30
J.L. Giraudel . S. Lek
SUl
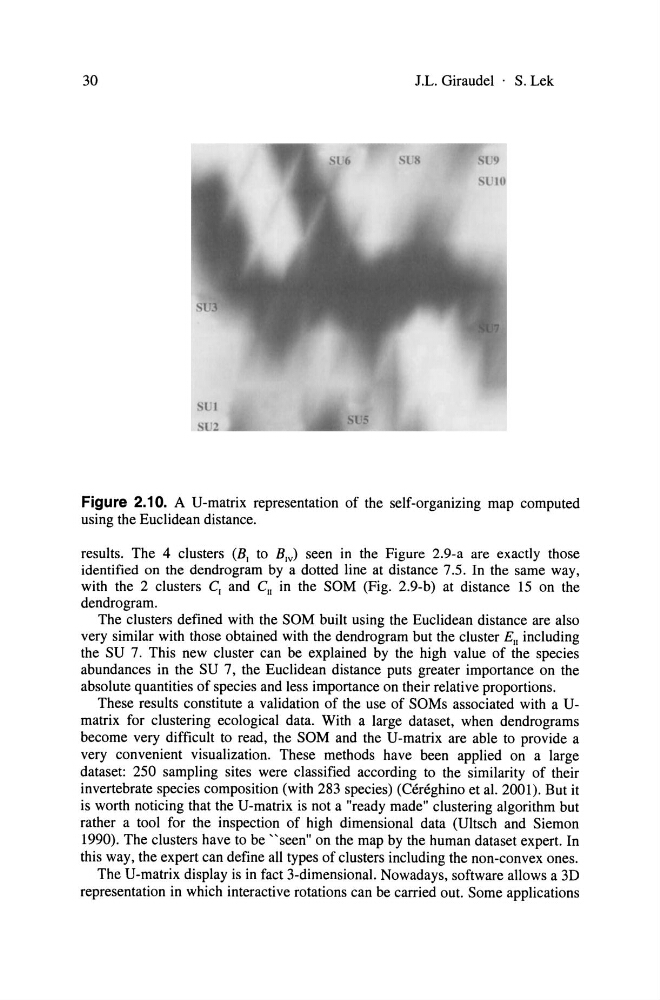
Figure 2.10. AU-matrix representation of the self-organizing map computed
using the Euclidean distance.
results. The 4 clusters (B, to B,v) seen in the Figure 2.9-a are exactly those
identified on the dendrogram by a dotted line at distance 7.5. In the same way,
with the 2 clusters C, and Cu in the SOM (Fig. 2.9-b) at distance 15 on the
dendrogram.
The clusters defined with the SOM built using the Euclidean distance are also
very similar with those obtained with the dendrogram but the cluster EIl including
the SU 7. This new cluster can be explained by the high value of the species
abundances in the SU 7, the Euclidean distance puts greater importance on the
absolute quantities of species and less importance on their relative proportions.
These results constitute a validation of the use of SOMs associated with a Umatrix for clustering ecological data. With a large dataset, when dendrograms
become very difficult to read, the SOM and the U-matrix are able to provide a
very convenient visualization. These methods have been applied on a large
dataset: 250 sampling sites were classified according to the similarity of their
invertebrate species composition (with 283 species) (Cen!ghino et al. 2001). But it
is worth noticing that the U-matrix is not a "ready made" clustering algorithm but
rather a tool for the inspection of high dimensional data (Ultsch and Siemon
1990). The clusters have to be "seen" on the map by the human dataset expert. In
this way, the expert can define all types of clusters including the non-convex ones.
The U-matrix display is in fact 3-dimensional. Nowadays, software allows a 3D
representation in which interactive rotations can be carried out. Some applications
J.L. Giraudel . S. Lek
SUl
Figure 2.10. AU-matrix representation of the self-organizing map computed
using the Euclidean distance.
results. The 4 clusters (B, to B,v) seen in the Figure 2.9-a are exactly those
identified on the dendrogram by a dotted line at distance 7.5. In the same way,
with the 2 clusters C, and Cu in the SOM (Fig. 2.9-b) at distance 15 on the
dendrogram.
The clusters defined with the SOM built using the Euclidean distance are also
very similar with those obtained with the dendrogram but the cluster EIl including
the SU 7. This new cluster can be explained by the high value of the species
abundances in the SU 7, the Euclidean distance puts greater importance on the
absolute quantities of species and less importance on their relative proportions.
These results constitute a validation of the use of SOMs associated with a Umatrix for clustering ecological data. With a large dataset, when dendrograms
become very difficult to read, the SOM and the U-matrix are able to provide a
very convenient visualization. These methods have been applied on a large
dataset: 250 sampling sites were classified according to the similarity of their
invertebrate species composition (with 283 species) (Cen!ghino et al. 2001). But it
is worth noticing that the U-matrix is not a "ready made" clustering algorithm but
rather a tool for the inspection of high dimensional data (Ultsch and Siemon
1990). The clusters have to be "seen" on the map by the human dataset expert. In
this way, the expert can define all types of clusters including the non-convex ones.
The U-matrix display is in fact 3-dimensional. Nowadays, software allows a 3D
representation in which interactive rotations can be carried out. Some applications