

28
J.L. Giraudel . S. Lek
structure, a new map will be built. When the learning process has been completed,
a map with c columns and c rows is obtained. In each hexagon of the map, VUs
have been defined (Fig. 2.8 - a) and the species abundances of each VU are
known. In order to visualize the cluster structure of the map, the key idea of the
Lli
1,2
. 111
·U2
S 3
(al
(b)
!>l4
5
4
SI7
6
U6
, 9
10
18
9
10
118
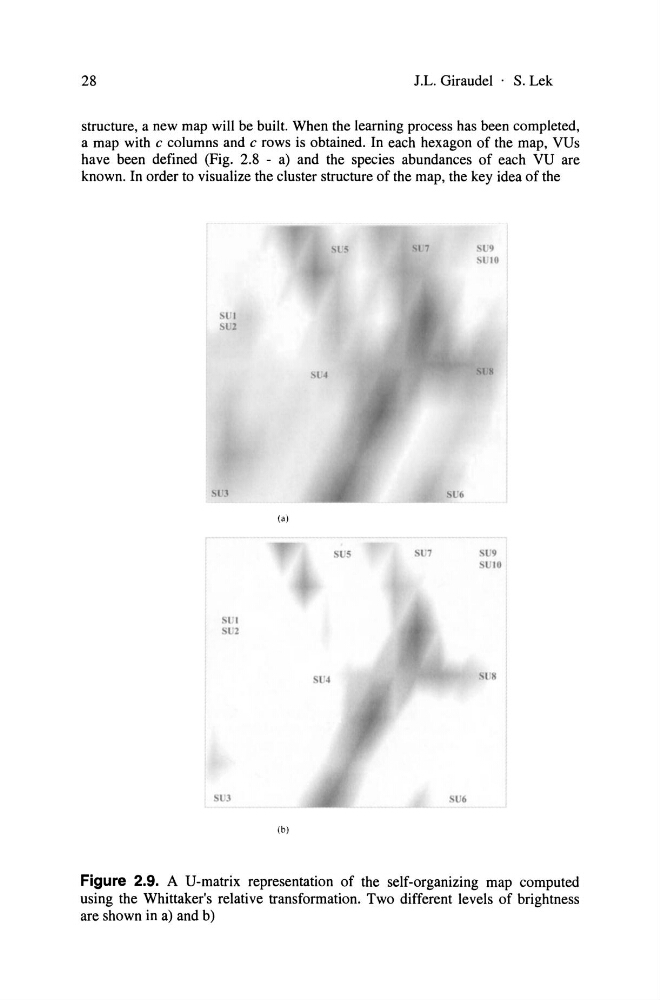
Figure 2.9. AU-matrix representation of the self-organizing map computed
using the Whittaker's relative transformation. Two different levels of brightness
are shown in a) and b)
J.L. Giraudel . S. Lek
structure, a new map will be built. When the learning process has been completed,
a map with c columns and c rows is obtained. In each hexagon of the map, VUs
have been defined (Fig. 2.8 - a) and the species abundances of each VU are
known. In order to visualize the cluster structure of the map, the key idea of the
Lli
1,2
. 111
·U2
S 3
(al
(b)
!>l4
5
4
SI7
6
U6
, 9
10
18
9
10
118
Figure 2.9. AU-matrix representation of the self-organizing map computed
using the Whittaker's relative transformation. Two different levels of brightness
are shown in a) and b)