

16
J.L. Giraudel . S. Lek
2.2
How to Compute a Self-Organizing Map (SOM) with an
Abundance Dataset?
2.2.1
A Dataset for Demonstrations
We consider a classical abundance dataset in the form of a matrix with n rows and
P columns, the rows representing the species and the columns the sampie units
(SUs); in addition, for each SU, environmental factors are sometimes available
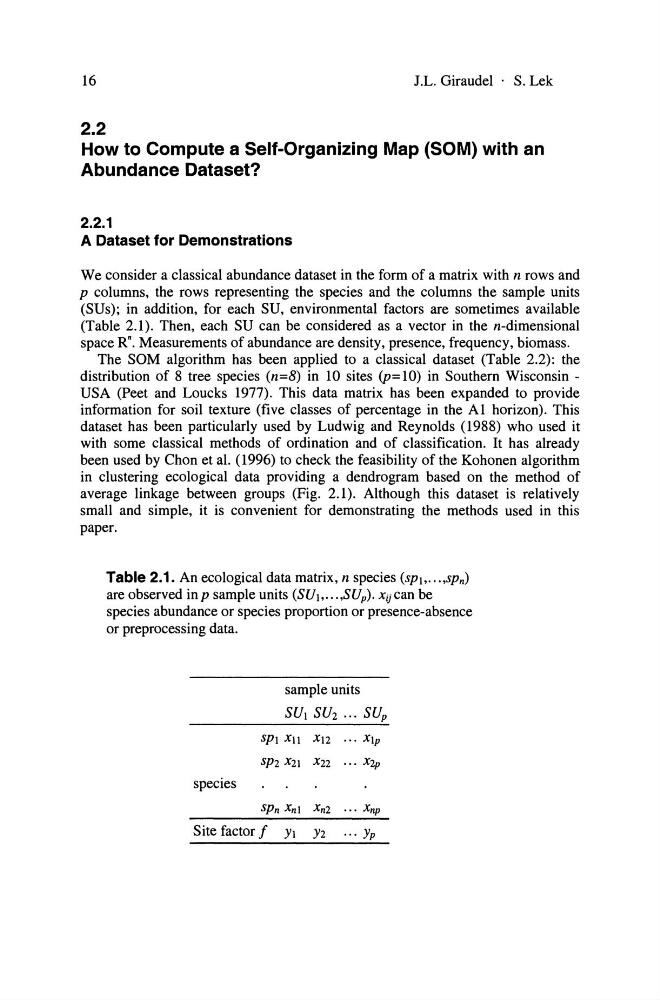
(Table 2.1). Then, each SU can be considered as a vector in the n-dimensional
space Rn. Measurements of abundance are density, presence, frequency, biomass.
The SOM algorithm has been applied to a classical dataset (Table 2.2): the
distribution of 8 tree species (n=8) in 10 sites (p= 10) in Southern Wisconsin -
USA (Peet and Loucks 1977). This data matrix has been expanded to provide
information for soil texture (five classes of percentage in the Al horizon). This
dataset has been particularly used by Ludwig and Reynolds (1988) who used it
with some classical methods of ordination and of classification. It has already
been used by Chon et al. (1996) to check the feasibility of the Kohonen algorithm
in clustering ecological data providing a dendrogram based on the method of
average linkage between groups (Fig. 2.1). Although this dataset is relatively
small and simple, it is convenient for demonstrating the methods used in this
paper.
Table 2.1. An ecological data matrix, n species (SPh .. "sPn)
are observed inp sampie units (SUh ... ,SUp)' xijcan be
species abundance or species proportion or presence-absence
or preprocessing data.
sampie units
SUI SU2 ... SUp
SPI XII X12 ... Xlp
SP2 X21 X22 ... X2p
species
SPn Xnl Xn2 ... xnp
Site factor f YI Y2 ..• Yp
J.L. Giraudel . S. Lek
2.2
How to Compute a Self-Organizing Map (SOM) with an
Abundance Dataset?
2.2.1
A Dataset for Demonstrations
We consider a classical abundance dataset in the form of a matrix with n rows and
P columns, the rows representing the species and the columns the sampie units
(SUs); in addition, for each SU, environmental factors are sometimes available
(Table 2.1). Then, each SU can be considered as a vector in the n-dimensional
space Rn. Measurements of abundance are density, presence, frequency, biomass.
The SOM algorithm has been applied to a classical dataset (Table 2.2): the
distribution of 8 tree species (n=8) in 10 sites (p= 10) in Southern Wisconsin -
USA (Peet and Loucks 1977). This data matrix has been expanded to provide
information for soil texture (five classes of percentage in the Al horizon). This
dataset has been particularly used by Ludwig and Reynolds (1988) who used it
with some classical methods of ordination and of classification. It has already
been used by Chon et al. (1996) to check the feasibility of the Kohonen algorithm
in clustering ecological data providing a dendrogram based on the method of
average linkage between groups (Fig. 2.1). Although this dataset is relatively
small and simple, it is convenient for demonstrating the methods used in this
paper.
Table 2.1. An ecological data matrix, n species (SPh .. "sPn)
are observed inp sampie units (SUh ... ,SUp)' xijcan be
species abundance or species proportion or presence-absence
or preprocessing data.
sampie units
SUI SU2 ... SUp
SPI XII X12 ... Xlp
SP2 X21 X22 ... X2p
species
SPn Xnl Xn2 ... xnp
Site factor f YI Y2 ..• Yp