

Chapter 18 . Identification of Marine Microalgae
357
maximum pulse intensity from the shape information, to investigate the
discriminability of different categories from pulse shape alone; the extra
information can then be supplied to the network via additional input parameters.
The following biological questions are specifically addressed: does pulse shape
improve discrimination between taxa? Which taxa can easily be discriminated
using pulse shape information alone and which cannot? Which taxa form clear
groups under pulse shape? If any of the taxa that can be identified on pulse shape
alone are taxa that are difficult to identify by the summary statistics usually used,
what features of the pulse shape are important in discrimination, and with wh at
structuraVmorphological features are they correlated?
(a)
o
50
100
150
200
250
~m
(b)
o
10
20
30
40
50
~m
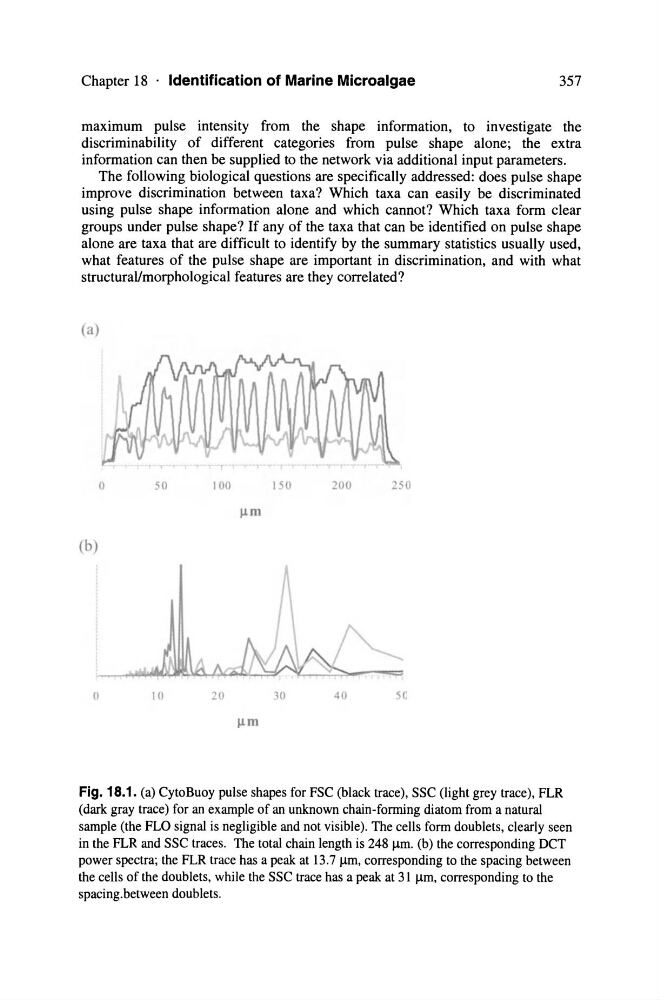
Fig. 18.1. (a) CytoBuoy pulse shapes for FSC (black trace), SSC (light grey trace), FLR
(dark gray trace) far an example of an unknown chain-forming diatom from a natural
sampie (the FLO signal is negligible and not visible). The cells form doublets, clearly seen
in the FLR and SSC traces. The total chain length is 248 /.lm. (b) the corresponding DCT
power spectra; the FLR trace has a peak at 13.7 /.lm, corresponding to the spacing between
the cells of the doub1ets, while the SSC trace has a peak at 31 /.lm, corresponding to the
spacing.between doublets.
357
maximum pulse intensity from the shape information, to investigate the
discriminability of different categories from pulse shape alone; the extra
information can then be supplied to the network via additional input parameters.
The following biological questions are specifically addressed: does pulse shape
improve discrimination between taxa? Which taxa can easily be discriminated
using pulse shape information alone and which cannot? Which taxa form clear
groups under pulse shape? If any of the taxa that can be identified on pulse shape
alone are taxa that are difficult to identify by the summary statistics usually used,
what features of the pulse shape are important in discrimination, and with wh at
structuraVmorphological features are they correlated?
(a)
o
50
100
150
200
250
~m
(b)
o
10
20
30
40
50
~m
Fig. 18.1. (a) CytoBuoy pulse shapes for FSC (black trace), SSC (light grey trace), FLR
(dark gray trace) far an example of an unknown chain-forming diatom from a natural
sampie (the FLO signal is negligible and not visible). The cells form doublets, clearly seen
in the FLR and SSC traces. The total chain length is 248 /.lm. (b) the corresponding DCT
power spectra; the FLR trace has a peak at 13.7 /.lm, corresponding to the spacing between
the cells of the doub1ets, while the SSC trace has a peak at 31 /.lm, corresponding to the
spacing.between doublets.