

348
D.G. Chen
f: 1L=::::....~==iL'" ...=:...JI I ~ I ~ I
o
-2.5
·2.0
·1 .5
-' .0
.0.5
0 .0
.0.0002
0.0
0.0002
0.0004
RIck ..... 1·a2
Rlcker b l-b2
1000
2000
3000
4000
0.0
0.2
04
0.6
MSY Spawner under Cool Regime
MSY Exploitation Rale under Cool Regime
I f~I~1
5000 10000 15000 20000 25000 30000
MSY Spawner under Warm Regime
0.5
0 .6
0.7
0.8
M$Y Exptortation Rate under Warm Regime
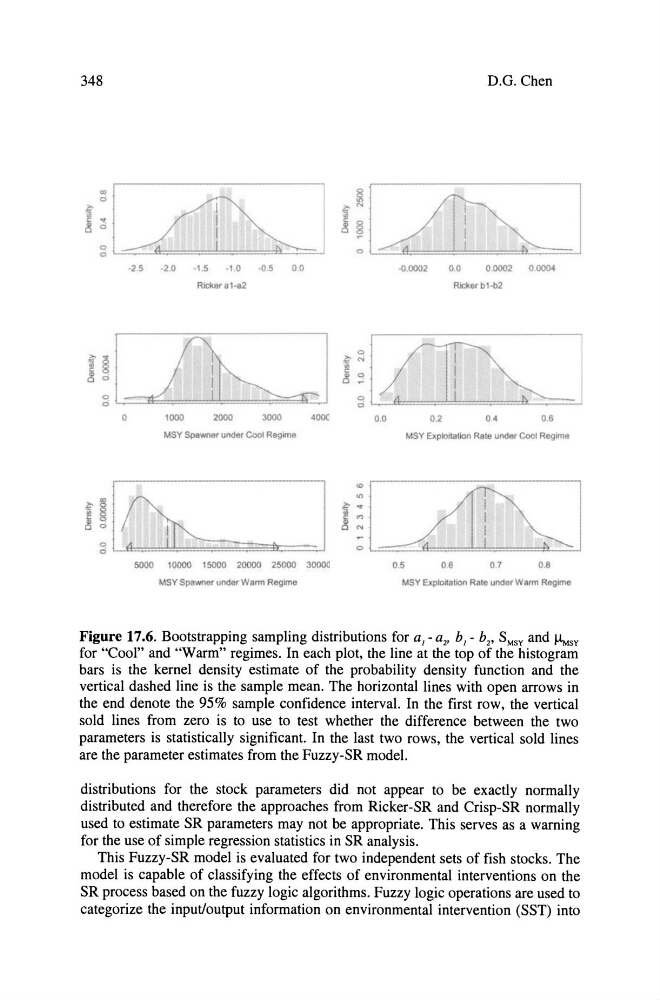
Figure 17.6. Bootstrapping sampling distributions for a J - a 2 , b J - b 2 , SMSY and I-IMSY
for "Cool" and "Warm" regimes. In each plot, the line at the top of the histogram
bars is the kernel density estimate of the probability density function and the
vertical dashed line is the sampie mean. The horizontal lines with open arrows in
the end denote the 95% sampie confidence interval. In the first row, the vertical
sold lines from zero is to use to test whether the difference between the two
parameters is statistically significant. In the last two rows, the vertical sold lines
are the parameter estimates from the Fuzzy-SR model.
distributions for the stock parameters did not appear to be exactly normally
distributed and therefore the approaches from Ricker-SR and Crisp-SR normally
used to estimate SR parameters may not be appropriate. This serves as a warning
for the use of simple regression statistics in SR analysis.
This Fuzzy-SR model is evaluated for two independent sets of fish stocks. The
model is capable of classifying the effects of environmental interventions on the
SR process based on the fuzzy logic algorithms. Fuzzy logic operations are used to
categorize the input/output information on environmental intervention (SST) into
D.G. Chen
f: 1L=::::....~==iL'" ...=:...JI I ~ I ~ I
o
-2.5
·2.0
·1 .5
-' .0
.0.5
0 .0
.0.0002
0.0
0.0002
0.0004
RIck ..... 1·a2
Rlcker b l-b2
1000
2000
3000
4000
0.0
0.2
04
0.6
MSY Spawner under Cool Regime
MSY Exploitation Rale under Cool Regime
I f~I~1
5000 10000 15000 20000 25000 30000
MSY Spawner under Warm Regime
0.5
0 .6
0.7
0.8
M$Y Exptortation Rate under Warm Regime
Figure 17.6. Bootstrapping sampling distributions for a J - a 2 , b J - b 2 , SMSY and I-IMSY
for "Cool" and "Warm" regimes. In each plot, the line at the top of the histogram
bars is the kernel density estimate of the probability density function and the
vertical dashed line is the sampie mean. The horizontal lines with open arrows in
the end denote the 95% sampie confidence interval. In the first row, the vertical
sold lines from zero is to use to test whether the difference between the two
parameters is statistically significant. In the last two rows, the vertical sold lines
are the parameter estimates from the Fuzzy-SR model.
distributions for the stock parameters did not appear to be exactly normally
distributed and therefore the approaches from Ricker-SR and Crisp-SR normally
used to estimate SR parameters may not be appropriate. This serves as a warning
for the use of simple regression statistics in SR analysis.
This Fuzzy-SR model is evaluated for two independent sets of fish stocks. The
model is capable of classifying the effects of environmental interventions on the
SR process based on the fuzzy logic algorithms. Fuzzy logic operations are used to
categorize the input/output information on environmental intervention (SST) into