

Chapter 15 . Evolved Predictive Rules for Aigal Dynamics
307
DO
1 E (15.2,17.3)
14
MICRO=0.249
P04
2 (42.38,00)
278
MICRO=379 000
/ '
'"
P04
pR
(-00,25.32)
2489
3 ( -00,9.365)
4
170
MICRO=0.249
MICRO=0.249
I
WTEMP
5 (26.66,00)
31
MICRO=379 000
I
DO
6 (-00,15.24)
68
MICRO=0.249
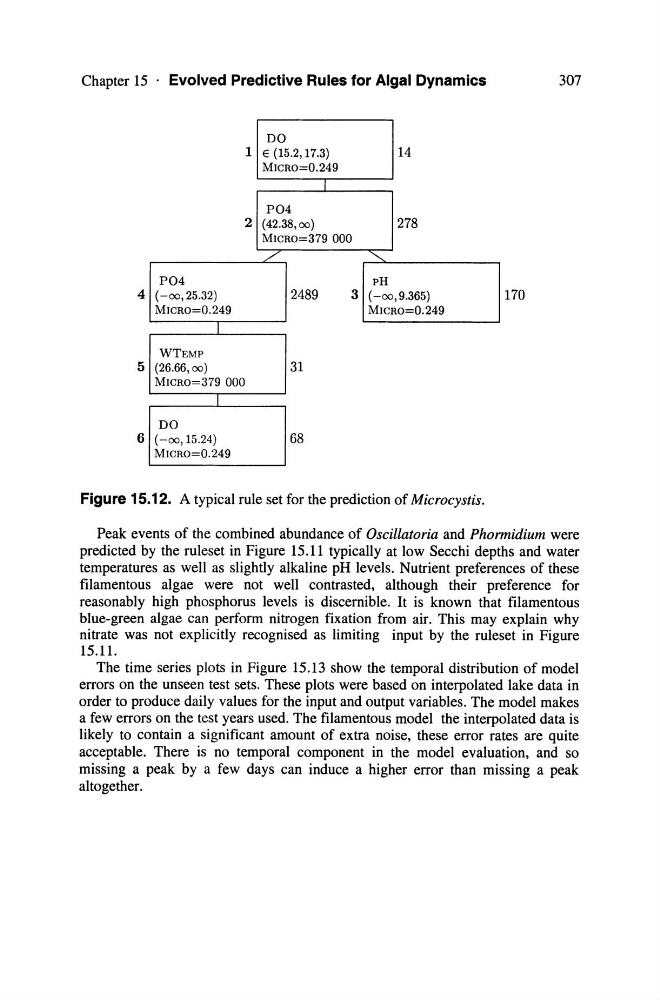
Figure 15.12. A typical rule set for the prediction of Microcystis.
Peak events of the combined abundance of Oscillatoria and Phormidium were
predicted by the ruleset in Figure 15.11 typically at low Secchi depths and water
temperatures as weIl as slightly alkaline pR levels. Nutrient preferences of these
filamentous algae were not weIl contras ted, although their preference for
reasonably high phosphorus levels is discemible. It is known that filamentous
blue-green algae can perform nitrogen fixation from air. This may explain why
nitrate was not explicitly recognised as limiting input by the ruleset in Figure
15.11.
The time series plots in Figure 15.13 show the temporal distribution of model
errors on the unseen test sets. These plots were based on interpolated lake data in
order to produce daily values for the input and output variables. The model makes
a few errors on the test years used. The filamentous model the interpolated data is
likely to contain a significant amount of extra noise, these error rates are quite
acceptable. There is no temporal component in the model evaluation, and so
missing a peak by a few days can induce a higher error than missing a peak
altogether.
307
DO
1 E (15.2,17.3)
14
MICRO=0.249
P04
2 (42.38,00)
278
MICRO=379 000
/ '
'"
P04
pR
(-00,25.32)
2489
3 ( -00,9.365)
4
170
MICRO=0.249
MICRO=0.249
I
WTEMP
5 (26.66,00)
31
MICRO=379 000
I
DO
6 (-00,15.24)
68
MICRO=0.249
Figure 15.12. A typical rule set for the prediction of Microcystis.
Peak events of the combined abundance of Oscillatoria and Phormidium were
predicted by the ruleset in Figure 15.11 typically at low Secchi depths and water
temperatures as weIl as slightly alkaline pR levels. Nutrient preferences of these
filamentous algae were not weIl contras ted, although their preference for
reasonably high phosphorus levels is discemible. It is known that filamentous
blue-green algae can perform nitrogen fixation from air. This may explain why
nitrate was not explicitly recognised as limiting input by the ruleset in Figure
15.11.
The time series plots in Figure 15.13 show the temporal distribution of model
errors on the unseen test sets. These plots were based on interpolated lake data in
order to produce daily values for the input and output variables. The model makes
a few errors on the test years used. The filamentous model the interpolated data is
likely to contain a significant amount of extra noise, these error rates are quite
acceptable. There is no temporal component in the model evaluation, and so
missing a peak by a few days can induce a higher error than missing a peak
altogether.