

302
J. Bobbin . F. Recknagel
Comparison of two runs on unseen test years
Predieted and aetual ehlorophyll-a level using input set 1
.... klual
- _ o d
J ~ I
0
50
'00
.50
200
250
300
350 0
50
'00
'50
200
250
300
350
'986
'993
Predieted and aetual ehlorophyll-a level using input set 2
klual
-
PT.dlc:lod
1
~ I
j
..
"
' .
..
0
50
.00
.50
200
250
300
350
0
50
'00
.50
200
250
300
350
.986
.993
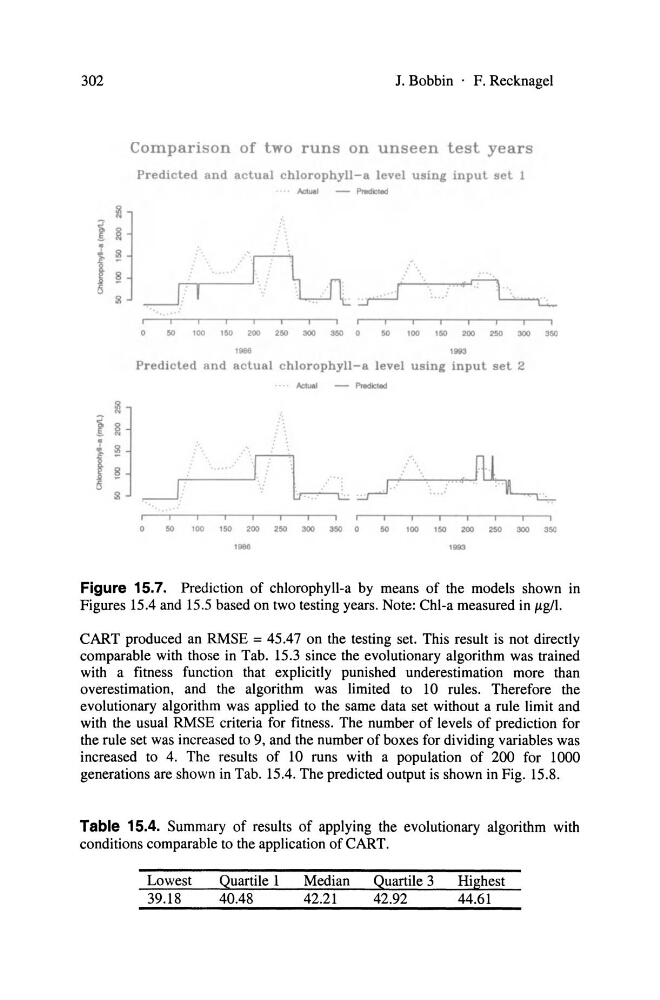
Figure 15.7. Prediction of chlorophyll-a by means of the models shown in
Figures 15.4 and 15.5 based on two testing years. Note: Chl-a measured in p.gll.
CART produced an RMSE = 45.47 on the testing set. This result is not directly
comparable with those in Tab. 15.3 since the evolutionary algorithm was trained
with a fitness function that explicitly punished underestimation more than
overestimation, and the algorithm was limited to 10 rules. Therefore the
evolutionary algorithm was applied to the same data set without a rule limit and
with the usual RMSE criteria for fitness. The number of levels of prediction for
the rule set was increased to 9, and the number ofboxes for dividing variables was
increased to 4. The results of 10 runs with a population of 200 for 1000
generations are shown in Tab. 15.4. The predicted output is shown in Fig. 15.8.
Table 15.4. Summary of results of applying the evolutionary algorithm with
conditions comparable to the application of CART.
Lowest
Quartile 1
Median
Quartile 3
Highest
39.18
40.48
42.21
42.92
44.61
J. Bobbin . F. Recknagel
Comparison of two runs on unseen test years
Predieted and aetual ehlorophyll-a level using input set 1
.... klual
- _ o d
J ~ I
0
50
'00
.50
200
250
300
350 0
50
'00
'50
200
250
300
350
'986
'993
Predieted and aetual ehlorophyll-a level using input set 2
klual
-
PT.dlc:lod
1
~ I
j
..
"
' .
..
0
50
.00
.50
200
250
300
350
0
50
'00
.50
200
250
300
350
.986
.993
Figure 15.7. Prediction of chlorophyll-a by means of the models shown in
Figures 15.4 and 15.5 based on two testing years. Note: Chl-a measured in p.gll.
CART produced an RMSE = 45.47 on the testing set. This result is not directly
comparable with those in Tab. 15.3 since the evolutionary algorithm was trained
with a fitness function that explicitly punished underestimation more than
overestimation, and the algorithm was limited to 10 rules. Therefore the
evolutionary algorithm was applied to the same data set without a rule limit and
with the usual RMSE criteria for fitness. The number of levels of prediction for
the rule set was increased to 9, and the number ofboxes for dividing variables was
increased to 4. The results of 10 runs with a population of 200 for 1000
generations are shown in Tab. 15.4. The predicted output is shown in Fig. 15.8.
Table 15.4. Summary of results of applying the evolutionary algorithm with
conditions comparable to the application of CART.
Lowest
Quartile 1
Median
Quartile 3
Highest
39.18
40.48
42.21
42.92
44.61