

300
6
1. Bobbin . F. Recknagel
IF
PHOSPHATE
18
4 medium THEN CHL- A 18
extremely high
EXCEP110N
IF P H 18 not high THEN
5 CHL-A JS very high
Description
Value
Transparency is high
Transp > 93cm
pH is high
pH > 9.2
pH is not high
pH < 9.2
Nitrate is low
N03 < 560!ig/1
Phosphate is medium
25 < P04 <= 168!ig/1
Oxygen is not high
DO < 18mg/1
Chlorophyll-a is low
Chl-a = 44mg/1
Chlorophyll-a is medium
Chl-a = 60mg/1
Chlorophyll-a is high
Chl-a = 101mg/1
Chlorophyll-a is very high
Chl-a = 112mg/1
Chlorophyll-a is extremely high
Chl-a = 174mg/1
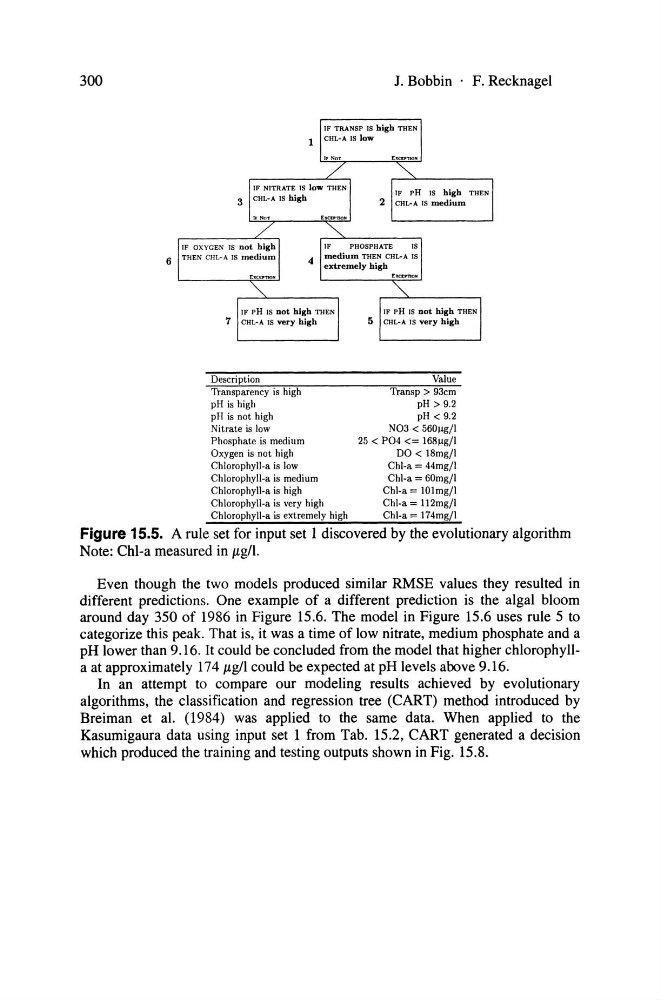
Figure 15.5. A rule set for input set 1 discovered by the evolutionary algorithm
Note: Chl-a measured in f.lg/I.
Even though the two models produced similar RMSE values they resulted in
different predictions. One example of a different prediction is the algal bloom
around day 350 of 1986 in Figure 15.6. The model in Figure 15.6 uses rule 5 to
categorize this peak. That is, it was a time of low nitrate, medium phosphate and a
pH lower than 9.16. It could be concluded from the model that higher chlorophylla at approximately 174 f.lg/I could be expected at pH levels above 9.16.
In an attempt to compare our modeling results achieved by evolutionary
algorithms, the classification and regression tree (CART) method introduced by
Breiman et al. (1984) was applied to the same data. When applied to the
Kasumigaura data using input set 1 from Tab. 15.2, CART generated adecision
which produced the training and testing outputs shown in Fig. 15.8.
6
1. Bobbin . F. Recknagel
IF
PHOSPHATE
18
4 medium THEN CHL- A 18
extremely high
EXCEP110N
IF P H 18 not high THEN
5 CHL-A JS very high
Description
Value
Transparency is high
Transp > 93cm
pH is high
pH > 9.2
pH is not high
pH < 9.2
Nitrate is low
N03 < 560!ig/1
Phosphate is medium
25 < P04 <= 168!ig/1
Oxygen is not high
DO < 18mg/1
Chlorophyll-a is low
Chl-a = 44mg/1
Chlorophyll-a is medium
Chl-a = 60mg/1
Chlorophyll-a is high
Chl-a = 101mg/1
Chlorophyll-a is very high
Chl-a = 112mg/1
Chlorophyll-a is extremely high
Chl-a = 174mg/1
Figure 15.5. A rule set for input set 1 discovered by the evolutionary algorithm
Note: Chl-a measured in f.lg/I.
Even though the two models produced similar RMSE values they resulted in
different predictions. One example of a different prediction is the algal bloom
around day 350 of 1986 in Figure 15.6. The model in Figure 15.6 uses rule 5 to
categorize this peak. That is, it was a time of low nitrate, medium phosphate and a
pH lower than 9.16. It could be concluded from the model that higher chlorophylla at approximately 174 f.lg/I could be expected at pH levels above 9.16.
In an attempt to compare our modeling results achieved by evolutionary
algorithms, the classification and regression tree (CART) method introduced by
Breiman et al. (1984) was applied to the same data. When applied to the
Kasumigaura data using input set 1 from Tab. 15.2, CART generated adecision
which produced the training and testing outputs shown in Fig. 15.8.