

260
C. Karul . S. Soyupak
Or-----_.------~----_.------~----_.
Calculated
log(chloro-1
-2
phyll-a)
-3
.-/,.
o
0/'/'
//0
,,/
,/,/ <ä>
c/
o
o
R = 0.888
-6L-----~------~-----k------~----~
-5
-4
-3
-2
-1
o
Measured log(chlorophyll-a)
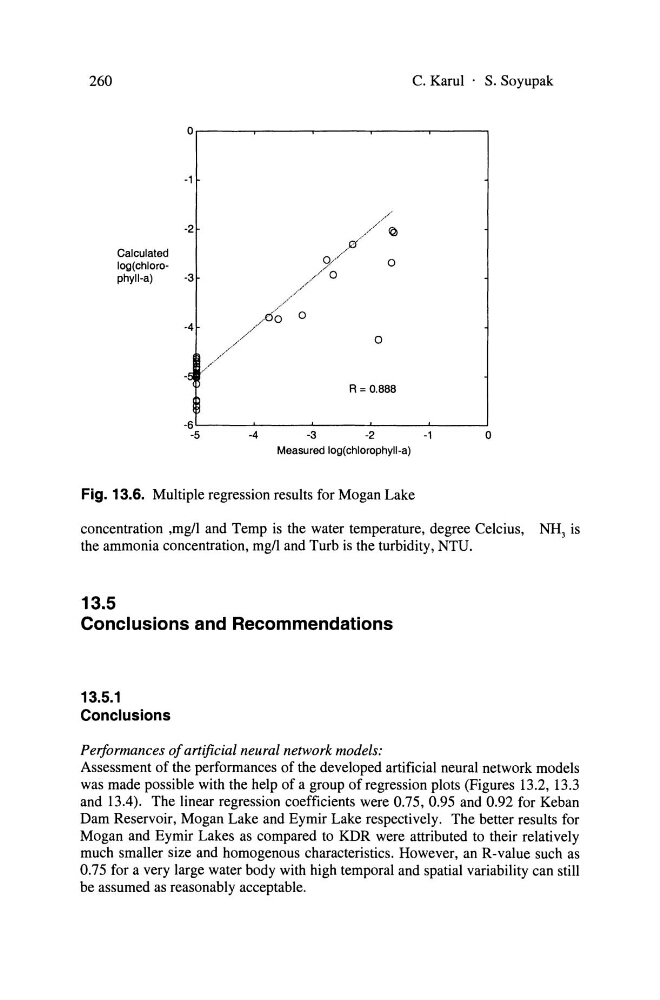
Fig. 13.6. Multiple regression results for Mogan Lake
concentration ,mg/l and Temp is the water temperature, degree Celcius, NH 3 is
the ammonia concentration, mg/l and Turb is the turbidity, NTU.
13.5
Conclusions and Recommendations
13.5.1
Conclusions
Performances 0/ artificial neural network models:
Assessment of the performances of the developed artificial neural network models
was made possible with the help of a group of regression plots (Figures 13.2, 13.3
and 13.4). The linear regression coefficients were 0.75, 0.95 and 0.92 for Keban
Dam Reservoir, Mogan Lake and Eymir Lake respectively. The better results for
Mogan and Eymir Lakes as compared to KDR were attributed to their relatively
much sm aller size and homogenous characteristics. However, an R-value such as
0.75 for a very large water body with high temporal and spatial variability can still
be assumed as reasonably acceptable.
C. Karul . S. Soyupak
Or-----_.------~----_.------~----_.
Calculated
log(chloro-1
-2
phyll-a)
-3
.-/,.
o
0/'/'
//0
,,/
,/,/ <ä>
c/
o
o
R = 0.888
-6L-----~------~-----k------~----~
-5
-4
-3
-2
-1
o
Measured log(chlorophyll-a)
Fig. 13.6. Multiple regression results for Mogan Lake
concentration ,mg/l and Temp is the water temperature, degree Celcius, NH 3 is
the ammonia concentration, mg/l and Turb is the turbidity, NTU.
13.5
Conclusions and Recommendations
13.5.1
Conclusions
Performances 0/ artificial neural network models:
Assessment of the performances of the developed artificial neural network models
was made possible with the help of a group of regression plots (Figures 13.2, 13.3
and 13.4). The linear regression coefficients were 0.75, 0.95 and 0.92 for Keban
Dam Reservoir, Mogan Lake and Eymir Lake respectively. The better results for
Mogan and Eymir Lakes as compared to KDR were attributed to their relatively
much sm aller size and homogenous characteristics. However, an R-value such as
0.75 for a very large water body with high temporal and spatial variability can still
be assumed as reasonably acceptable.