

Chapter 12 . Pattern Analysis of Endemie Fish Speeies in Rivers
239
Profile method
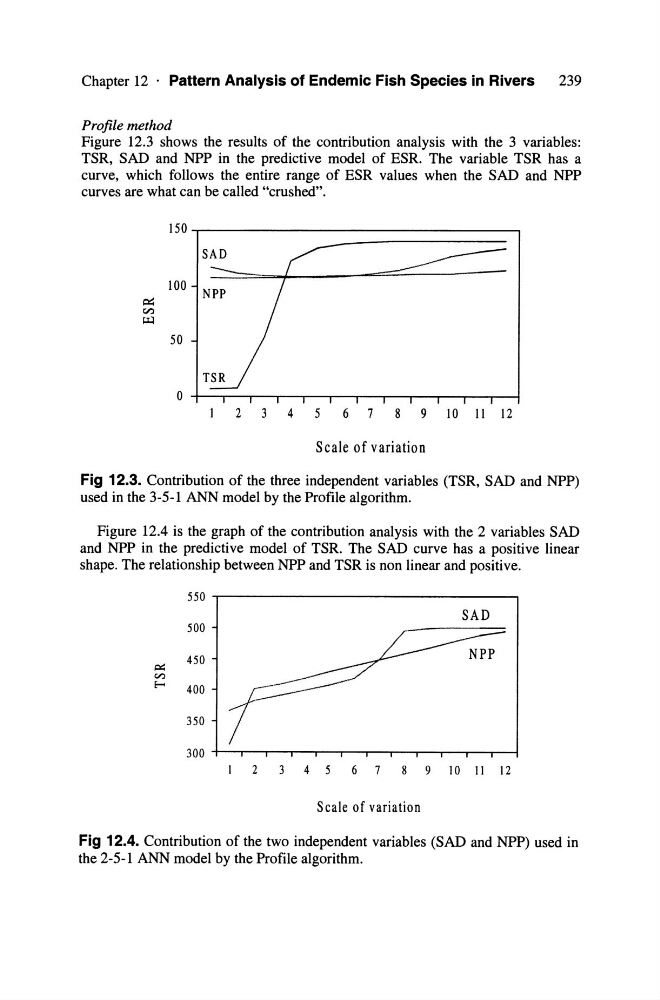
Figure 12.3 shows the results of the contribution analysis with the 3 variables:
TSR, SAD and NPP in the predictive model of ESR. The variable TSR has a
curve, wh ich follows the entire range of ESR values when the SAD and NPP
curves are what can be called "crushed".
150~----------------------------------,
SAD
100 NPP
~
50
2 3 4 5 6 7 8 9 10 11 12
Scale of variation
Fig 12.3. Contribution of the three independent variables (TSR, SAD and NPP)
used in the 3-5-1 ANN model by the Profile algorithm.
Figure 12.4 is the graph of the contribution analysis with the 2 variables SAD
and NPP in the predictive model of TSR. The SAD curve has a positive linear
shape. The relationship between NPP and TSR is non linear and positive.
Fig 12.4. Contribution of the two independent variables (SAD and NPP) used in
the 2-5-1 ANN model by the Profile algorithm.
239
Profile method
Figure 12.3 shows the results of the contribution analysis with the 3 variables:
TSR, SAD and NPP in the predictive model of ESR. The variable TSR has a
curve, wh ich follows the entire range of ESR values when the SAD and NPP
curves are what can be called "crushed".
150~----------------------------------,
SAD
100 NPP
~
50
2 3 4 5 6 7 8 9 10 11 12
Scale of variation
Fig 12.3. Contribution of the three independent variables (TSR, SAD and NPP)
used in the 3-5-1 ANN model by the Profile algorithm.
Figure 12.4 is the graph of the contribution analysis with the 2 variables SAD
and NPP in the predictive model of TSR. The SAD curve has a positive linear
shape. The relationship between NPP and TSR is non linear and positive.
Fig 12.4. Contribution of the two independent variables (SAD and NPP) used in
the 2-5-1 ANN model by the Profile algorithm.