

Chapter 12 . Pattern Analysis of Endemie Fish Speeies in Rivers
235
ni
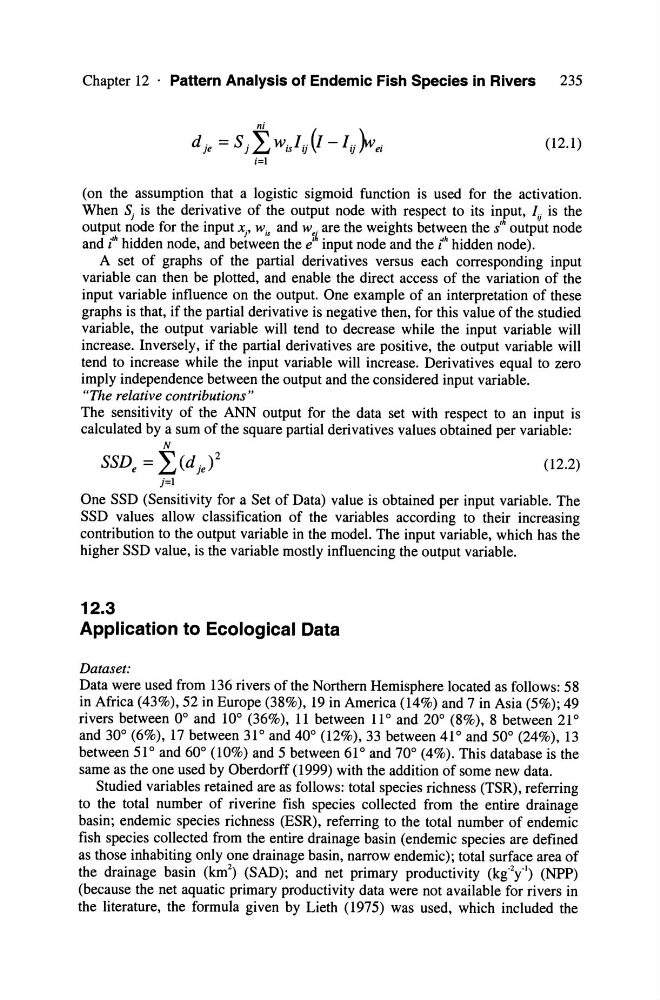
d je =SjLWi)ij(I-lij)wei
(12.1)
i=l
(on the assumption that a logistie sigmoid funetion is used for the aetivation.
When Sj is the derivative of the output node with respect to its input, Iij is the
output node for the input Xj' wir and w •. are the weights between the S'h output node
and t hidden node, and between the e!k input node and the t hidden node).
A set of graphs of the partial derivatives versus eaeh eorresponding input
variable ean then be plotted, and enable the direet aeeess of the variation of the
input variable influenee on the output. One example of an interpretation of these
graphs is that, if the partial derivative is negative then, for this value of the studied
variable, the output variable will tend to decrease while the input variable will
inerease. Inversely, if the partial derivatives are positive, the output variable will
tend to inerease while the input variable will inerease. Derivatives equal to zero
imply independenee between the output and the eonsidered input variable.
"The relative contributions"
The sensitivity of the ANN output for the data set with respect to an input is
ealculated by a sum of the square partial derivatives values obtained per variable:
N
SSD e = LCd je )2
(12.2)
j=l
One SSD (Sensitivity for a Set of Data) value is obtained per input variable. The
SSD values allow classifieation of the variables aeeording to their inereasing
eontribution to the output variable in the model. The input variable, whieh has the
higher SSD value, is the variable mostly influeneing the output variable.
12.3
Application to Ecological Oata
Dataset:
Data were used from 136 rivers of the Northem Hemisphere loeated as folIows: 58
in Afriea (43%), 52 in Europe (38%), 19 in Ameriea (14%) and 7 in Asia (5%); 49
rivers between 0° and 10° (36%), 11 between 11 ° and 20° (8%), 8 between 21 °
and 30° (6%),17 between 31 ° and 40° (12%), 33 between 41 ° and 50° (24%),13
between 51 ° and 60° (10%) and 5 between 61 ° and 70° (4%). This database is the
same as the one used by Oberdorff (1999) with the addition of some new data.
Studied variables retained are as folIows: total species riehness (TSR), referring
to the total number of riverine fish species eollected from the entire drainage
basin; endemie species riehness (ESR), referring to the total number of endemie
fish species eollected from the entire drainage basin (endemie speeies are defined
as those inhabiting only one drainage basin, narrow endemie); total surfaee area of
the drainage basin (km 2 ) (SAD); and net primary produetivity (kg- 2 y-l) (NPP)
(beeause the net aquatie primary produetivity data were not available for rivers in
the literature, the formula given by Lieth (1975) was used, whieh included the
235
ni
d je =SjLWi)ij(I-lij)wei
(12.1)
i=l
(on the assumption that a logistie sigmoid funetion is used for the aetivation.
When Sj is the derivative of the output node with respect to its input, Iij is the
output node for the input Xj' wir and w •. are the weights between the S'h output node
and t hidden node, and between the e!k input node and the t hidden node).
A set of graphs of the partial derivatives versus eaeh eorresponding input
variable ean then be plotted, and enable the direet aeeess of the variation of the
input variable influenee on the output. One example of an interpretation of these
graphs is that, if the partial derivative is negative then, for this value of the studied
variable, the output variable will tend to decrease while the input variable will
inerease. Inversely, if the partial derivatives are positive, the output variable will
tend to inerease while the input variable will inerease. Derivatives equal to zero
imply independenee between the output and the eonsidered input variable.
"The relative contributions"
The sensitivity of the ANN output for the data set with respect to an input is
ealculated by a sum of the square partial derivatives values obtained per variable:
N
SSD e = LCd je )2
(12.2)
j=l
One SSD (Sensitivity for a Set of Data) value is obtained per input variable. The
SSD values allow classifieation of the variables aeeording to their inereasing
eontribution to the output variable in the model. The input variable, whieh has the
higher SSD value, is the variable mostly influeneing the output variable.
12.3
Application to Ecological Oata
Dataset:
Data were used from 136 rivers of the Northem Hemisphere loeated as folIows: 58
in Afriea (43%), 52 in Europe (38%), 19 in Ameriea (14%) and 7 in Asia (5%); 49
rivers between 0° and 10° (36%), 11 between 11 ° and 20° (8%), 8 between 21 °
and 30° (6%),17 between 31 ° and 40° (12%), 33 between 41 ° and 50° (24%),13
between 51 ° and 60° (10%) and 5 between 61 ° and 70° (4%). This database is the
same as the one used by Oberdorff (1999) with the addition of some new data.
Studied variables retained are as folIows: total species riehness (TSR), referring
to the total number of riverine fish species eollected from the entire drainage
basin; endemie species riehness (ESR), referring to the total number of endemie
fish species eollected from the entire drainage basin (endemie speeies are defined
as those inhabiting only one drainage basin, narrow endemie); total surfaee area of
the drainage basin (km 2 ) (SAD); and net primary produetivity (kg- 2 y-l) (NPP)
(beeause the net aquatie primary produetivity data were not available for rivers in
the literature, the formula given by Lieth (1975) was used, whieh included the