

164
T.-S. Chon . Y.S. Park' I.-S. Kwak . E.Y. Cha
(Grossberg 1969, 1982). At the layer L2, Wl qi for Y (W2 pi for X), which is the
connecting weight between p node of the Grossberg layer and i node (winner) of
the Kohonen layer, was updated by the iterative method as shown in the process 6
in Fig. 19. Beta (fJ) (ca., 0.3) is a parameter determining the learning rate. Similar
to the Kohonen layer, the weights were initially given as small random numbers.
Kohonen
Grossberg
X vector layer
G · ' /;
i !
! I
! I
Evaluation U x /
L:J!
X"
X'"
I
I
"
layer
Yvector
\ \
. \
\ \
\\·····B
\ \
,
i \
Y
Trained results
. \
\ \
\
\
i \
\BN~\
i
i
Y"
Predicted data
Y'"
Realdata
-----+ Network training ......... ~ Trained network
----. From Xnew to Y"
---.. From Ynew to X"
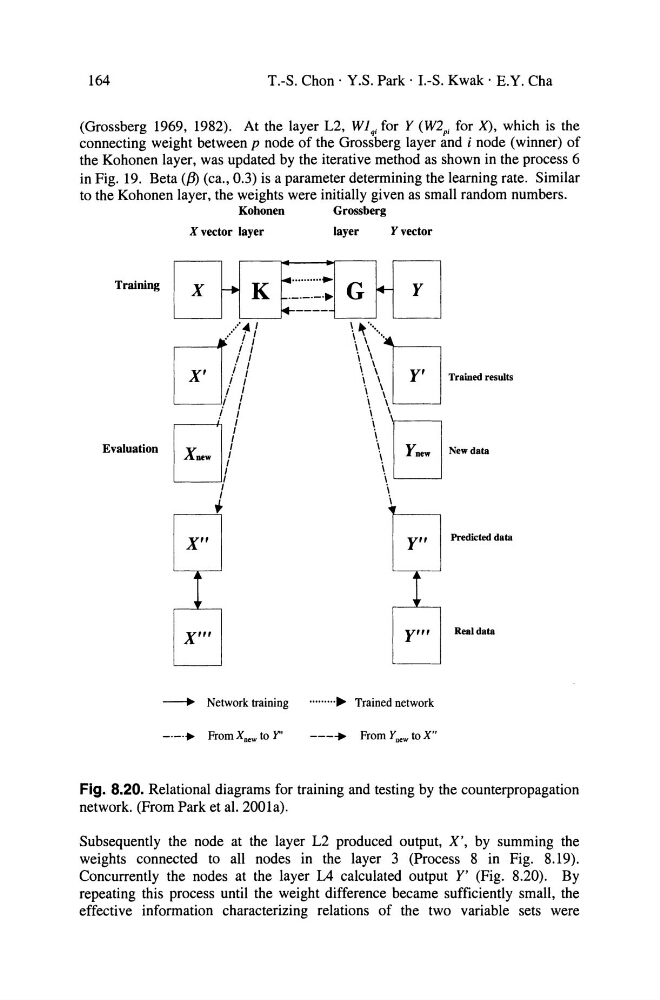
Fig. 8.20. Relational diagrams for training and testing by the counterpropagation
network. (From Park et al. 2001a).
Subsequently the node at the layer L2 produced output, X', by summing the
weights connected to all nodes in the layer 3 (Process 8 in Fig. 8.19).
Concurrently the nodes at the layer L4 calculated output Y' (Fig. 8.20). By
repeating this process until the weight difference became sufficiently small, the
effective information characterizing relations of the two variable sets were
T.-S. Chon . Y.S. Park' I.-S. Kwak . E.Y. Cha
(Grossberg 1969, 1982). At the layer L2, Wl qi for Y (W2 pi for X), which is the
connecting weight between p node of the Grossberg layer and i node (winner) of
the Kohonen layer, was updated by the iterative method as shown in the process 6
in Fig. 19. Beta (fJ) (ca., 0.3) is a parameter determining the learning rate. Similar
to the Kohonen layer, the weights were initially given as small random numbers.
Kohonen
Grossberg
X vector layer
G · ' /;
i !
! I
! I
Evaluation U x /
L:J!
X"
X'"
I
I
"
layer
Yvector
\ \
. \
\ \
\\·····B
\ \
,
i \
Y
Trained results
. \
\ \
\
\
i \
\BN~\
i
i
Y"
Predicted data
Y'"
Realdata
-----+ Network training ......... ~ Trained network
----. From Xnew to Y"
---.. From Ynew to X"
Fig. 8.20. Relational diagrams for training and testing by the counterpropagation
network. (From Park et al. 2001a).
Subsequently the node at the layer L2 produced output, X', by summing the
weights connected to all nodes in the layer 3 (Process 8 in Fig. 8.19).
Concurrently the nodes at the layer L4 calculated output Y' (Fig. 8.20). By
repeating this process until the weight difference became sufficiently small, the
effective information characterizing relations of the two variable sets were