

162
T.-S. Chon . Y.S. Park' I.-S. Kwak . E.Y. Cha
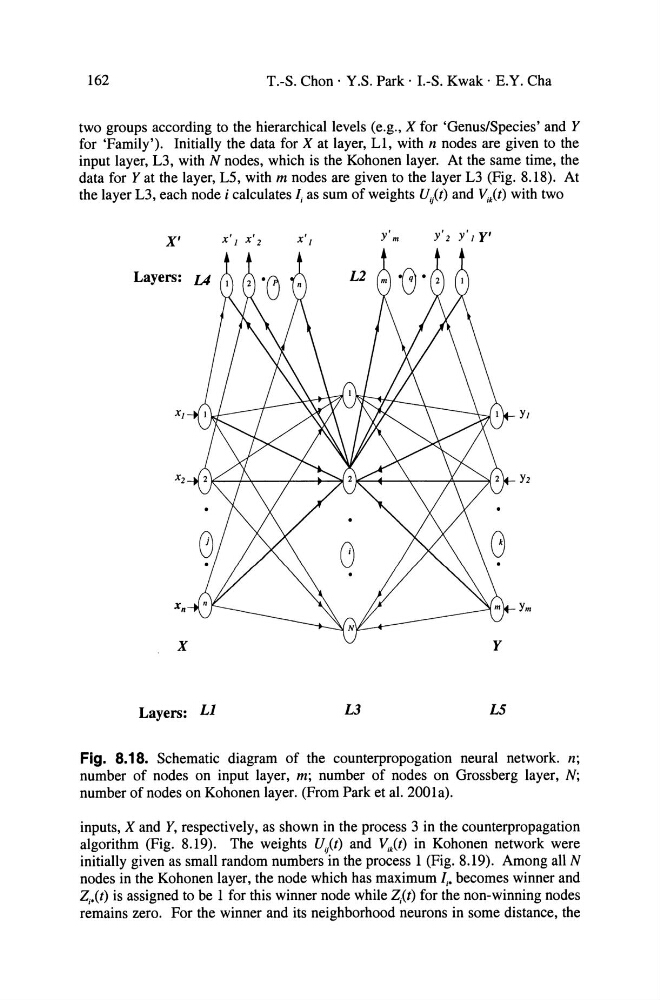
two groups according to the hierarchicallevels (e.g., X for 'Genus/Species' and Y
for 'Family'). Initially the data for X at layer, LI, with n nodes are given to the
input layer, L3, with N nodes, wh ich is the Kohonen layer. At the same time, the
data for Yat the layer, L5, with m nodes are given to the layer L3 (Fig. 8.18). At
the layer L3, each node i ca1culates ( as sum of weights U;/!) and Vjk(t) with two
X'
x' 1 x' 2
y' 2 y'J Y'
Layers:
YJ
Ym
X
Layers: LI
L3
LS
Fig. 8.18. Schematic diagram of the counterpropogation neural network. n;
number of nodes on input layer, m; number of nodes on Grossberg layer, N;
number of nodes on Kohonen layer. (From Park et al. 2001a).
inputs, X and Y, respectively, as shown in the process 3 in the counterpropagation
algorithm (Fig. 8.19). The weights U;/!) and V,k(t) in Kohonen network were
initially given as small random numbers in the process 1 (Fig. 8.19). Among all N
nodes in the Kohonen layer, the node which has maximum I j • becomes winner and
Zj.(t) is assigned to be 1 for this winner node while Zm for the non-winning nodes
remains zero. For the winner and its neighborhood neurons in some distance, the
T.-S. Chon . Y.S. Park' I.-S. Kwak . E.Y. Cha
two groups according to the hierarchicallevels (e.g., X for 'Genus/Species' and Y
for 'Family'). Initially the data for X at layer, LI, with n nodes are given to the
input layer, L3, with N nodes, wh ich is the Kohonen layer. At the same time, the
data for Yat the layer, L5, with m nodes are given to the layer L3 (Fig. 8.18). At
the layer L3, each node i ca1culates ( as sum of weights U;/!) and Vjk(t) with two
X'
x' 1 x' 2
y' 2 y'J Y'
Layers:
YJ
Ym
X
Layers: LI
L3
LS
Fig. 8.18. Schematic diagram of the counterpropogation neural network. n;
number of nodes on input layer, m; number of nodes on Grossberg layer, N;
number of nodes on Kohonen layer. (From Park et al. 2001a).
inputs, X and Y, respectively, as shown in the process 3 in the counterpropagation
algorithm (Fig. 8.19). The weights U;/!) and V,k(t) in Kohonen network were
initially given as small random numbers in the process 1 (Fig. 8.19). Among all N
nodes in the Kohonen layer, the node which has maximum I j • becomes winner and
Zj.(t) is assigned to be 1 for this winner node while Zm for the non-winning nodes
remains zero. For the winner and its neighborhood neurons in some distance, the