

Chapter 8· Analysis of Stream Macroinvertebrate Communities
135
map, which includes the sites of ST2W, ST3W, STlSU, ST2SP, STlA, ST2A,
ST3A, SY4W, etc. The area further below the border zone was mainly occupied
by the relatively clean sampie sites of the Cholma Stream along with other sites in
the Suyong and Soktae streams. Consequently, the mapping area appeared to be
divided according to the impact of pollution and topography of the streams. In the
clustering (Fig. 8.4), however, this organization of communities was not clearly
observed. The sampie sites were mainly lined up in different order of saprobic
levels.
Within these broad topographical dispositions of communities in the map of the
Kohonen network, the trained communities further appeared be organized in small
sc ale. For example, the group of CM2SU, CM3SU, CM4SU, and CM5SU
occurred in the same season (summer), while the other groups also appeared
according to different seasons (Fig. 8.3). This indicated that sampled communities
were organized in topographical dispositions firstly, and in seasons secondly. This
suggested the possibility of hierarchical organization in data grouping in SOM.
The Kohonen network not only allows grouping but also makes it possible to
pattemize new data, by assigning a new component (i.e., neuron). When a newly
collected community is given to the network as an input, it may be recognized
either as one of the already-determined patterns or as a new pattern (Chon et al.
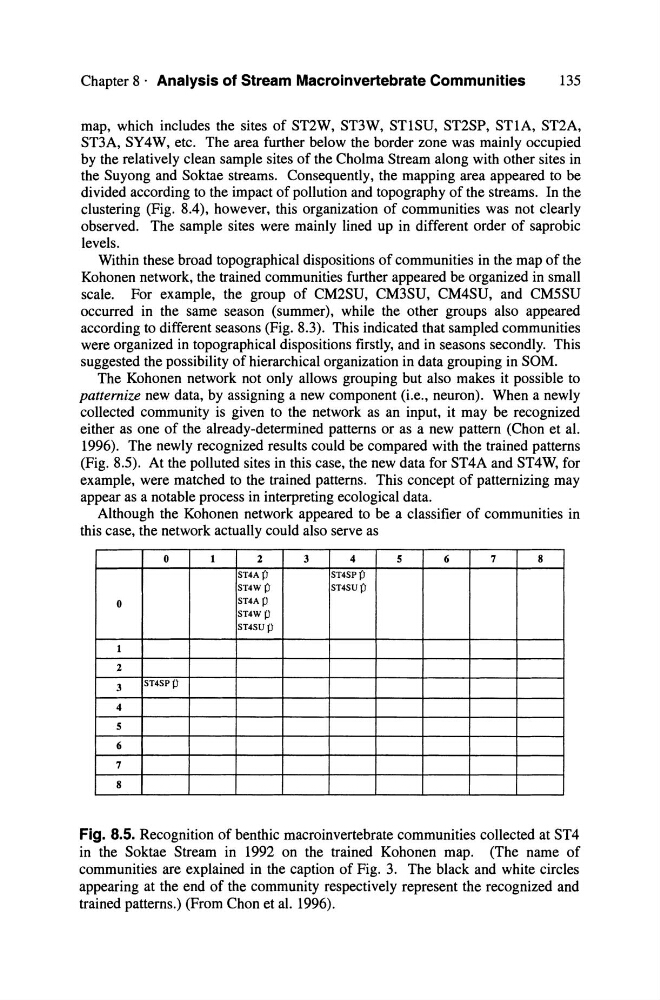
1996). The newly recognized results could be compared with the trained patterns
(Fig. 8.5). At the polluted sites in this case, the new data for ST4A and ST4W, for
example, were matched to the trained patterns. This concept of patternizing may
appear as a notable process in interpreting ecological data.
Although the Kohonen network appeared to be a classifier of communities in
this case, the network actually could also serve as
0
1
2
3
4
5
6
7
8
ST4A j')
ST4SPj')
ST4Wj')
ST4SUj')
0
ST4Ap
ST4WP
ST4SUP
1
2
3
ST4SPP
4
5
6
7
8
Fig. 8.5. Recognition of benthic macroinvertebrate communities collected at ST4
in the Soktae Stream in 1992 on the trained Kohonen map. (The name of
communities are explained in the caption of Fig. 3. The black and white circles
appearing at the end of the community respectively represent the recognized and
trained patterns.) (From Chon et al. 1996).
135
map, which includes the sites of ST2W, ST3W, STlSU, ST2SP, STlA, ST2A,
ST3A, SY4W, etc. The area further below the border zone was mainly occupied
by the relatively clean sampie sites of the Cholma Stream along with other sites in
the Suyong and Soktae streams. Consequently, the mapping area appeared to be
divided according to the impact of pollution and topography of the streams. In the
clustering (Fig. 8.4), however, this organization of communities was not clearly
observed. The sampie sites were mainly lined up in different order of saprobic
levels.
Within these broad topographical dispositions of communities in the map of the
Kohonen network, the trained communities further appeared be organized in small
sc ale. For example, the group of CM2SU, CM3SU, CM4SU, and CM5SU
occurred in the same season (summer), while the other groups also appeared
according to different seasons (Fig. 8.3). This indicated that sampled communities
were organized in topographical dispositions firstly, and in seasons secondly. This
suggested the possibility of hierarchical organization in data grouping in SOM.
The Kohonen network not only allows grouping but also makes it possible to
pattemize new data, by assigning a new component (i.e., neuron). When a newly
collected community is given to the network as an input, it may be recognized
either as one of the already-determined patterns or as a new pattern (Chon et al.
1996). The newly recognized results could be compared with the trained patterns
(Fig. 8.5). At the polluted sites in this case, the new data for ST4A and ST4W, for
example, were matched to the trained patterns. This concept of patternizing may
appear as a notable process in interpreting ecological data.
Although the Kohonen network appeared to be a classifier of communities in
this case, the network actually could also serve as
0
1
2
3
4
5
6
7
8
ST4A j')
ST4SPj')
ST4Wj')
ST4SUj')
0
ST4Ap
ST4WP
ST4SUP
1
2
3
ST4SPP
4
5
6
7
8
Fig. 8.5. Recognition of benthic macroinvertebrate communities collected at ST4
in the Soktae Stream in 1992 on the trained Kohonen map. (The name of
communities are explained in the caption of Fig. 3. The black and white circles
appearing at the end of the community respectively represent the recognized and
trained patterns.) (From Chon et al. 1996).