

116
I.M. Schleiter . M. Obach . R. Wagner· H. Wemer· H.-H. Schmidt
• • •••••••••
• • ••••••••
••••••••••• ••••••••••
••••••••••••• ••••••••••••• ••••••••••••• •••••••••••••
•••••••••••••••
•••••••••••••••
••••••••••••••• •••••••••••••••
••••••••••••
••••••••••••
••••••••••••• ••••••••••••• •••••••••••••
•••••••••••••••
••••••••••••••• •••••••••••••••
••••••••••••••• ••••••••••••••• ••••••••••••••• •••••••••••••••
. D. Borchardt
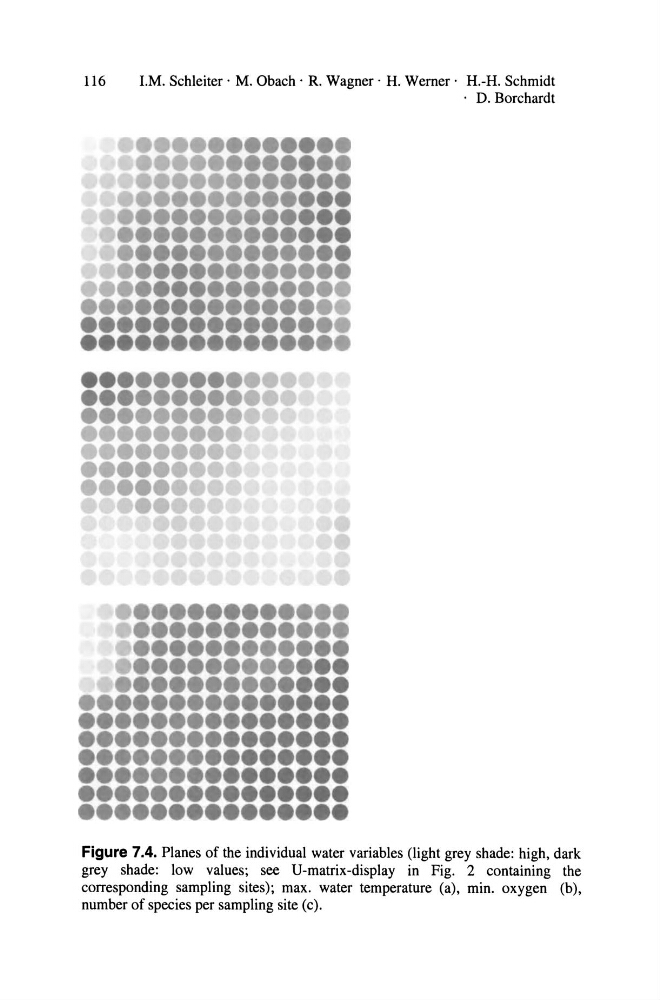
Figure 7.4. Planes of the individual water variables (light grey shade: high, dark
grey shade: low values; see U-matrix-display in Fig. 2 containing the
corresponding sampling sites); max. water temperature (a), min. oxygen (b),
number of species per sampling site (c).
I.M. Schleiter . M. Obach . R. Wagner· H. Wemer· H.-H. Schmidt
• • •••••••••
• • ••••••••
••••••••••• ••••••••••
••••••••••••• ••••••••••••• ••••••••••••• •••••••••••••
•••••••••••••••
•••••••••••••••
••••••••••••••• •••••••••••••••
••••••••••••
••••••••••••
••••••••••••• ••••••••••••• •••••••••••••
•••••••••••••••
••••••••••••••• •••••••••••••••
••••••••••••••• ••••••••••••••• ••••••••••••••• •••••••••••••••
. D. Borchardt
Figure 7.4. Planes of the individual water variables (light grey shade: high, dark
grey shade: low values; see U-matrix-display in Fig. 2 containing the
corresponding sampling sites); max. water temperature (a), min. oxygen (b),
number of species per sampling site (c).