

Chapter 6 . Stream Assessment
99
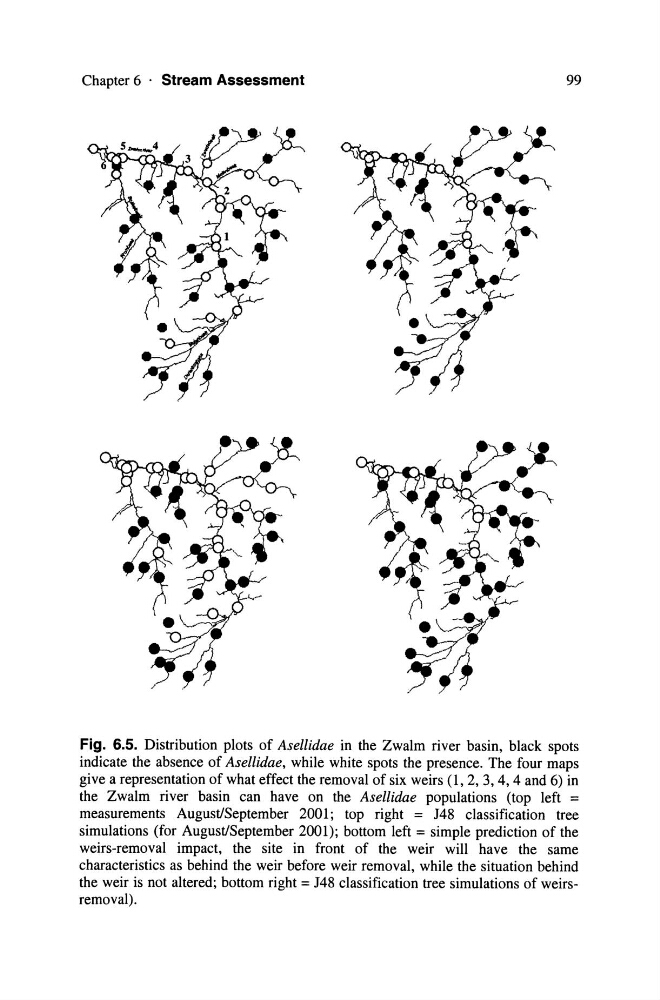
Fig. 6.5. Distribution plots of Asellidae in the Zwalm river basin, black spots
indicate the absence of Asellidae, while white spots the presence. The four maps
give a representation of what effect the removal of six weirs (1, 2, 3,4, 4 and 6) in
the Zwalm river basin can have on the Asellidae populations (top left =
measurements August/September 2001; top right = J48 classification tree
simulations (for August/September 2001); bottom left = simple prediction of the
weirs-removal impact, the site in front of the weir will have the same
characteristics as behind the weir before weir removal, while the situation behind
the weir is not altered; bottom right = J48 classification tree simulations of weirsremoval).
99
Fig. 6.5. Distribution plots of Asellidae in the Zwalm river basin, black spots
indicate the absence of Asellidae, while white spots the presence. The four maps
give a representation of what effect the removal of six weirs (1, 2, 3,4, 4 and 6) in
the Zwalm river basin can have on the Asellidae populations (top left =
measurements August/September 2001; top right = J48 classification tree
simulations (for August/September 2001); bottom left = simple prediction of the
weirs-removal impact, the site in front of the weir will have the same
characteristics as behind the weir before weir removal, while the situation behind
the weir is not altered; bottom right = J48 classification tree simulations of weirsremoval).