

4.5 The Adaptive Cycle: Of Time, Evolution, and Complexity
61
y
~
- -.... - -...... ~--... x
a
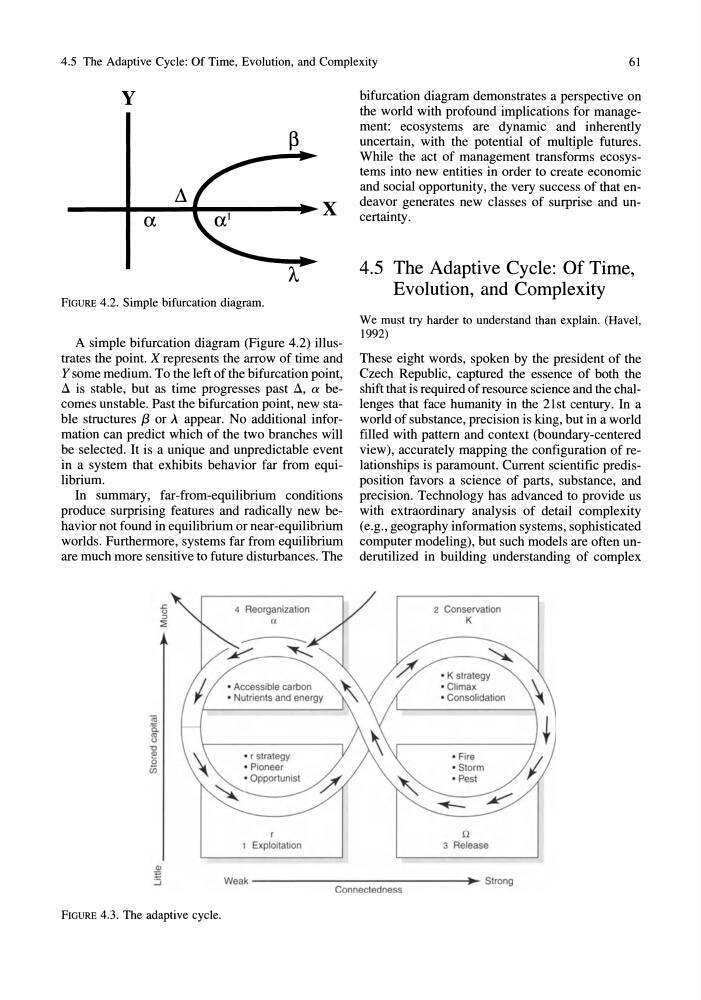
FIGURE 4.2. Simple bifurcation diagram.
A simple bifurcation diagram (Figure 4.2) illustrates the point. X represents the arrow of time and
Y some medium. To the left of the bifurcation point,
d is stable, but as time progresses past d, a becomes unstable. Past the bifurcation point, new stable structures f3 or A appear. No additional information can predict which of the two branches will
be selected. It is a unique and unpredictable event
in a system that exhibits behavior far from equilibrium.
In summary, far-from-equilibrium conditions
produce surprising features and radically new behavior not found in equilibrium or near-equilibrium
worlds. Furthermore, systems far from equilibrium
are much more sensitive to future disturbances. The
4 Reorganization
a
• Accessible carbon
• Nutrients and energy
• r strategy
• Pioneer
r
1 Exploitation
bifurcation diagram demonstrates a perspective on
the world with profound implications for management: ecosystems are dynamic and inherently
uncertain, with the potential of multiple futures.
While the act of management transforms ecosystems into new entities in order to create economic
and social opportunity, the very success of that endeavor generates new classes of surprise and uncertainty.
4.5 The Adaptive Cycle: Of Time,
Evolution, and Complexity
We must try harder to understand than explain. (Havel,
1992)
These eight words, spoken by the president of the
Czech Republic, captured the essence of both the
shift that is required of resource science and the challenges that face humanity in the 21st century. In a
world of substance, precision is king, but in a world
filled with pattern and context (boundary-centered
view), accurately mapping the configuration of relationships is paramount. Current scientific predisposition favors a science of parts, substance, and
precision. Technology has advanced to provide us
with extraordinary analysis of detail complexity
(e.g., geography information systems, sophisticated
computer modeling), but such models are often underutilized in building understanding of complex
2 Conservation
K
---~
• K strategy
• Climax
• Consolidation
• Fire
• Storm
• Pest
n
3 Release
Q)
E
:.J
Weak - - - - - - - - - - - - - - - - i l ...... Strong
Connectedness
FIGURE 4.3. The adaptive cycle.
61
y
~
- -.... - -...... ~--... x
a
FIGURE 4.2. Simple bifurcation diagram.
A simple bifurcation diagram (Figure 4.2) illustrates the point. X represents the arrow of time and
Y some medium. To the left of the bifurcation point,
d is stable, but as time progresses past d, a becomes unstable. Past the bifurcation point, new stable structures f3 or A appear. No additional information can predict which of the two branches will
be selected. It is a unique and unpredictable event
in a system that exhibits behavior far from equilibrium.
In summary, far-from-equilibrium conditions
produce surprising features and radically new behavior not found in equilibrium or near-equilibrium
worlds. Furthermore, systems far from equilibrium
are much more sensitive to future disturbances. The
4 Reorganization
a
• Accessible carbon
• Nutrients and energy
• r strategy
• Pioneer
r
1 Exploitation
bifurcation diagram demonstrates a perspective on
the world with profound implications for management: ecosystems are dynamic and inherently
uncertain, with the potential of multiple futures.
While the act of management transforms ecosystems into new entities in order to create economic
and social opportunity, the very success of that endeavor generates new classes of surprise and uncertainty.
4.5 The Adaptive Cycle: Of Time,
Evolution, and Complexity
We must try harder to understand than explain. (Havel,
1992)
These eight words, spoken by the president of the
Czech Republic, captured the essence of both the
shift that is required of resource science and the challenges that face humanity in the 21st century. In a
world of substance, precision is king, but in a world
filled with pattern and context (boundary-centered
view), accurately mapping the configuration of relationships is paramount. Current scientific predisposition favors a science of parts, substance, and
precision. Technology has advanced to provide us
with extraordinary analysis of detail complexity
(e.g., geography information systems, sophisticated
computer modeling), but such models are often underutilized in building understanding of complex
2 Conservation
K
---~
• K strategy
• Climax
• Consolidation
• Fire
• Storm
• Pest
n
3 Release
Q)
E
:.J
Weak - - - - - - - - - - - - - - - - i l ...... Strong
Connectedness
FIGURE 4.3. The adaptive cycle.