

32.6 Major Types of Analysis
485
Kentucky
South Carolina
Georgia
_
Rural
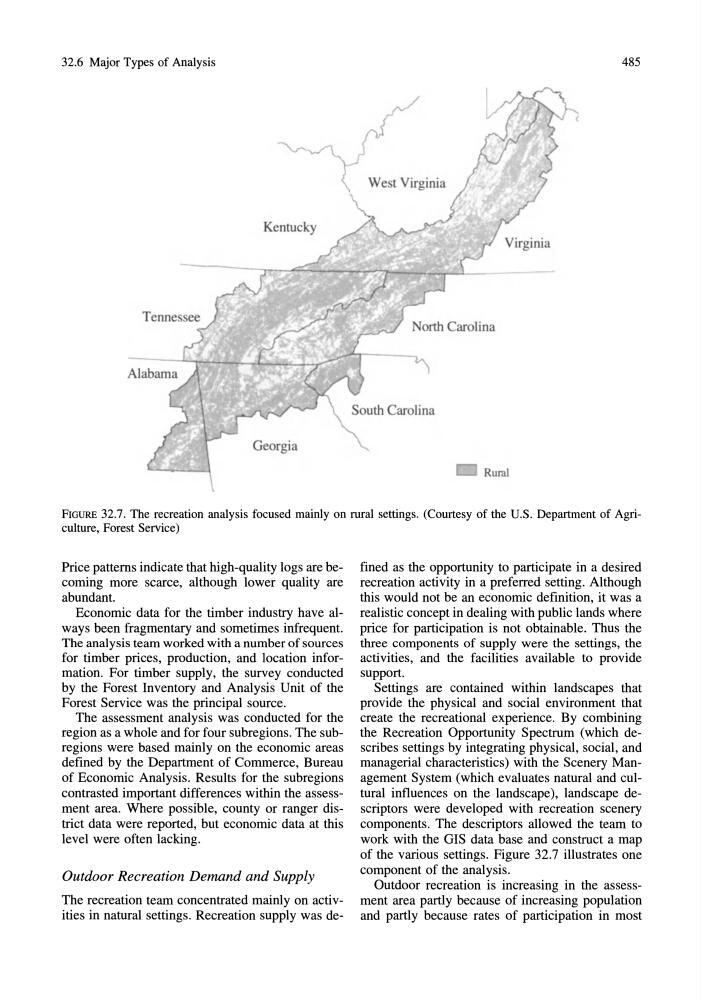
FIGURE 32.7. The recreation analysis focused mainly on rural settings. (Courtesy of the U.S. Department of Agriculture, Forest Service)
Price patterns indicate that high-quality logs are becoming more scarce, although lower quality are
abundant.
Economic data for the timber industry have always been fragmentary and sometimes infrequent.
The analysis team worked with a number of sources
for timber prices, production, and location information. For timber supply, the survey conducted
by the Forest Inventory and Analysis Unit of the
Forest Service was the principal source.
The assessment analysis was conducted for the
region as a whole and for four subregions. The subregions were based mainly on the economic areas
defined by the Department of Commerce, Bureau
of Economic Analysis. Results for the subregions
contrasted important differences within the assessment area. Where possible, county or ranger district data were reported, but economic data at this
level were often lacking.
Outdoor Recreation Demand and Supply
The recreation team concentrated mainly on activities in natural settings. Recreation supply was defined as the opportunity to participate in a desired
recreation activity in a preferred setting. Although
this would not be an economic definition, it was a
realistic concept in dealing with public lands where
price for participation is not obtainable. Thus the
three components of supply were the settings, the
activities, and the facilities available to provide
support.
Settings are contained within landscapes that
provide the physical and social environment that
create the recreational experience. By combining
the Recreation Opportunity Spectrum (which describes settings by integrating physical, social, and
managerial characteristics) with the Scenery Management System (which evaluates natural and cultural influences on the landscape), landscape descriptors were developed with recreation scenery
components. The descriptors allowed the team to
work with the GIS data base and construct a map
of the various settings. Figure 32.7 illustrates one
component of the analysis.
Outdoor recreation is increasing in the assessment area partly because of increasing population
and partly because rates of participation in most
485
Kentucky
South Carolina
Georgia
_
Rural
FIGURE 32.7. The recreation analysis focused mainly on rural settings. (Courtesy of the U.S. Department of Agriculture, Forest Service)
Price patterns indicate that high-quality logs are becoming more scarce, although lower quality are
abundant.
Economic data for the timber industry have always been fragmentary and sometimes infrequent.
The analysis team worked with a number of sources
for timber prices, production, and location information. For timber supply, the survey conducted
by the Forest Inventory and Analysis Unit of the
Forest Service was the principal source.
The assessment analysis was conducted for the
region as a whole and for four subregions. The subregions were based mainly on the economic areas
defined by the Department of Commerce, Bureau
of Economic Analysis. Results for the subregions
contrasted important differences within the assessment area. Where possible, county or ranger district data were reported, but economic data at this
level were often lacking.
Outdoor Recreation Demand and Supply
The recreation team concentrated mainly on activities in natural settings. Recreation supply was defined as the opportunity to participate in a desired
recreation activity in a preferred setting. Although
this would not be an economic definition, it was a
realistic concept in dealing with public lands where
price for participation is not obtainable. Thus the
three components of supply were the settings, the
activities, and the facilities available to provide
support.
Settings are contained within landscapes that
provide the physical and social environment that
create the recreational experience. By combining
the Recreation Opportunity Spectrum (which describes settings by integrating physical, social, and
managerial characteristics) with the Scenery Management System (which evaluates natural and cultural influences on the landscape), landscape descriptors were developed with recreation scenery
components. The descriptors allowed the team to
work with the GIS data base and construct a map
of the various settings. Figure 32.7 illustrates one
component of the analysis.
Outdoor recreation is increasing in the assessment area partly because of increasing population
and partly because rates of participation in most