

480
o
Southern Appalachian Case Study
o
...
•
Sulfur Dioxide
(tons per year)
Less th an 2,000
2.000 - 10,000
10.000 - 25,000
Greater than 25.000
SAA Study Area
Emissions Domain
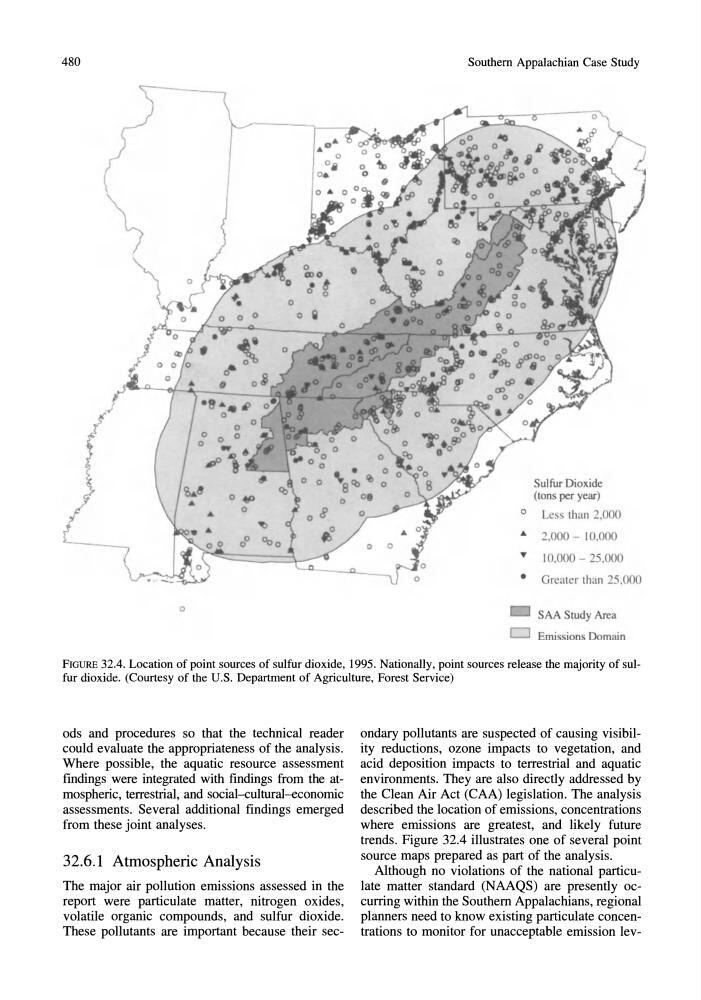
FIGURE 32.4. Location of point sources of sulfur dioxide, 1995. Nationally, point sources release the majority of sulfur dioxide. (Courtesy of the U.S. Department of Agriculture, Forest Service)
ods and procedures so that the technical reader
could evaluate the appropriateness of the analysis.
Where possible, the aquatic resource assessment
[mdings were integrated with findings from the atmospheric, terrestrial, and social~ultural-economic
assessments. Several additional findings emerged
from these joint analyses.
32.6.1 Atmospheric Analysis
The major air pollution emissions assessed in the
report were particulate matter, nitrogen oxides,
volatile organic compounds, and sulfur dioxide.
These pollutants are important because their secondary pollutants are suspected of causing visibility reductions, ozone impacts to vegetation, and
acid deposition impacts to terrestrial and aquatic
environments. They are also directly addressed by
the Clean Air Act (CAA) legislation. The analysis
described the location of emissions, concentrations
where emissions are greatest, and likely future
trends. Figure 32.4 illustrates one of several point
source maps prepared as part of the analysis.
Although no violations of the national particulate matter standard (NAAQS) are presently occurring within the Southern Appalachians, regional
planners need to know existing particulate concentrations to monitor for unacceptable emission lev-
o
Southern Appalachian Case Study
o
...
•
Sulfur Dioxide
(tons per year)
Less th an 2,000
2.000 - 10,000
10.000 - 25,000
Greater than 25.000
SAA Study Area
Emissions Domain
FIGURE 32.4. Location of point sources of sulfur dioxide, 1995. Nationally, point sources release the majority of sulfur dioxide. (Courtesy of the U.S. Department of Agriculture, Forest Service)
ods and procedures so that the technical reader
could evaluate the appropriateness of the analysis.
Where possible, the aquatic resource assessment
[mdings were integrated with findings from the atmospheric, terrestrial, and social~ultural-economic
assessments. Several additional findings emerged
from these joint analyses.
32.6.1 Atmospheric Analysis
The major air pollution emissions assessed in the
report were particulate matter, nitrogen oxides,
volatile organic compounds, and sulfur dioxide.
These pollutants are important because their secondary pollutants are suspected of causing visibility reductions, ozone impacts to vegetation, and
acid deposition impacts to terrestrial and aquatic
environments. They are also directly addressed by
the Clean Air Act (CAA) legislation. The analysis
described the location of emissions, concentrations
where emissions are greatest, and likely future
trends. Figure 32.4 illustrates one of several point
source maps prepared as part of the analysis.
Although no violations of the national particulate matter standard (NAAQS) are presently occurring within the Southern Appalachians, regional
planners need to know existing particulate concentrations to monitor for unacceptable emission lev-