

478
Kentucky
Georgia
West Virginia
Southern Appalachian Case Study
Reservation
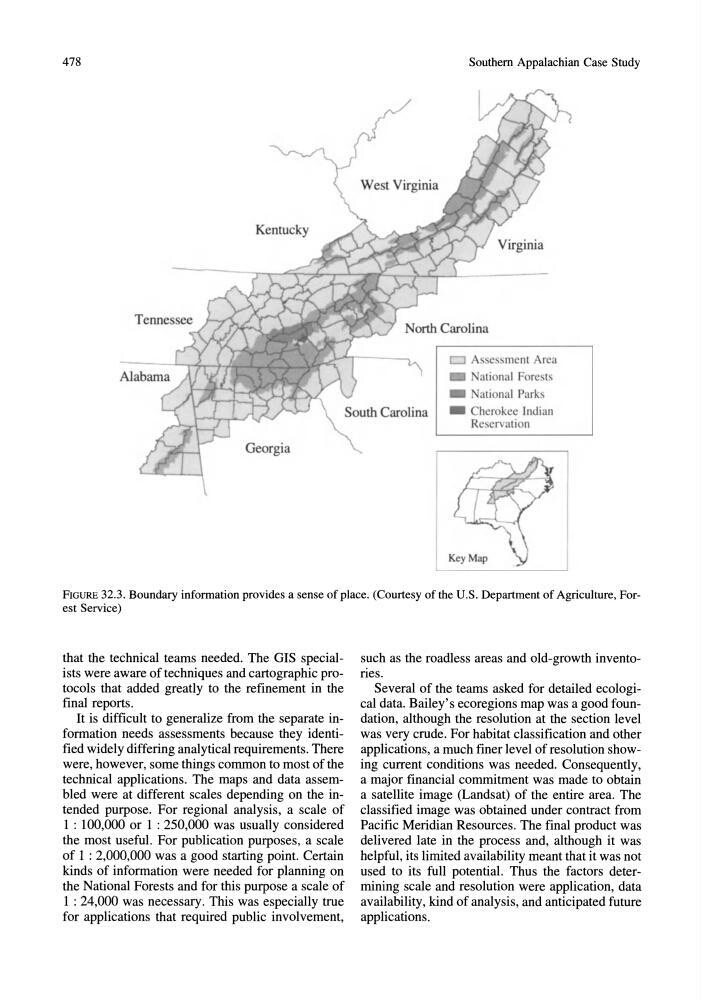
FIGURE 32.3. Boundary information provides a sense of place. (Courtesy of the U.S. Department of Agriculture, Forest Service)
that the technical teams needed. The GIS specialists were aware of techniques and cartographic protocols that added greatly to the refinement in the
final reports.
It is difficult to generalize from the separate information needs assessments because they identified widely differing analytical requirements. There
were, however, some things common to most of the
technical applications. The maps and data assembled were at different scales depending on the intended purpose. For regional analysis, a scale of
1 : 100,000 or 1 : 250,000 was usually considered
the most useful. For publication purposes, a scale
of 1 : 2,000,000 was a good starting point. Certain
kinds of information were needed for planning on
the National Forests and for this purpose a scale of
1 : 24,000 was necessary. This was especially true
for applications that required public involvement,
such as the roadless areas and old-growth inventories.
Several of the teams asked for detailed ecological data. Bailey's ecoregions map was a good foundation, although the resolution at the section level
was very crude. For habitat classification and other
applications, a much finer level of resolution showing current conditions was needed. Consequently,
a major financial commitment was made to obtain
a satellite image (Landsat) of the entire area. The
classified image was obtained under contract from
Pacific Meridian Resources. The final product was
delivered late in the process and, although it was
helpful, its limited availability meant that it was not
used to its full potential. Thus the factors determining scale and resolution were application, data
availability, kind of analysis, and anticipated future
applications.
Kentucky
Georgia
West Virginia
Southern Appalachian Case Study
Reservation
FIGURE 32.3. Boundary information provides a sense of place. (Courtesy of the U.S. Department of Agriculture, Forest Service)
that the technical teams needed. The GIS specialists were aware of techniques and cartographic protocols that added greatly to the refinement in the
final reports.
It is difficult to generalize from the separate information needs assessments because they identified widely differing analytical requirements. There
were, however, some things common to most of the
technical applications. The maps and data assembled were at different scales depending on the intended purpose. For regional analysis, a scale of
1 : 100,000 or 1 : 250,000 was usually considered
the most useful. For publication purposes, a scale
of 1 : 2,000,000 was a good starting point. Certain
kinds of information were needed for planning on
the National Forests and for this purpose a scale of
1 : 24,000 was necessary. This was especially true
for applications that required public involvement,
such as the roadless areas and old-growth inventories.
Several of the teams asked for detailed ecological data. Bailey's ecoregions map was a good foundation, although the resolution at the section level
was very crude. For habitat classification and other
applications, a much finer level of resolution showing current conditions was needed. Consequently,
a major financial commitment was made to obtain
a satellite image (Landsat) of the entire area. The
classified image was obtained under contract from
Pacific Meridian Resources. The final product was
delivered late in the process and, although it was
helpful, its limited availability meant that it was not
used to its full potential. Thus the factors determining scale and resolution were application, data
availability, kind of analysis, and anticipated future
applications.