

27.3 Intangible Elements
. .
N
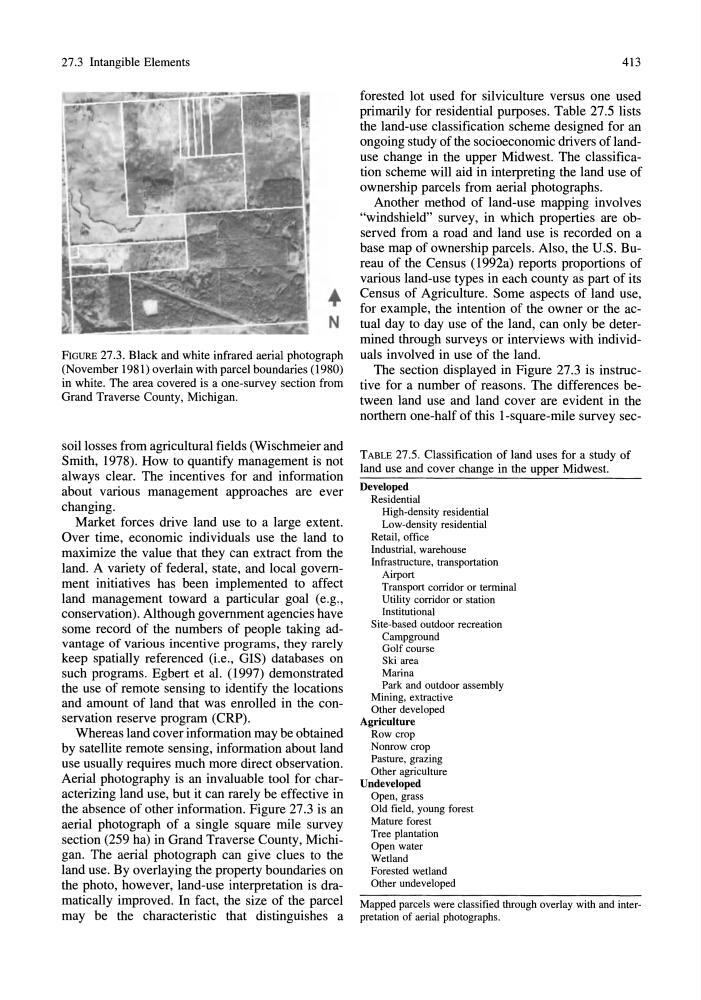
FIGURE 27.3. Black and white infrared aerial photograph
(November 1981) overlain with parcel boundaries (1980)
in white. The area covered is a one-survey section from
Grand Traverse County, Michigan.
soil losses from agricultural fields (Wischmeier and
Smith, 1978). How to quantify management is not
always clear. The incentives for and information
about various management approaches are ever
changing.
Market forces drive land use to a large extent.
Over time, economic individuals use the land to
maximize the value that they can extract from the
land. A variety of federal, state, and local government initiatives has been implemented to affect
land management toward a particular goal (e.g.,
conservation). Although government agencies have
some record of the numbers of people taking advantage of various incentive programs, they rarely
keep spatially referenced (i.e., GIS) databases on
such programs. Egbert et al. (1997) demonstrated
the use of remote sensing to identify the locations
and amount of land that was enrolled in the conservation reserve program (CRP).
Whereas land cover information may be obtained
by satellite remote sensing, information about land
use usually requires much more direct observation.
Aerial photography is an invaluable tool for characterizing land use, but it can rarely be effective in
the absence of other information. Figure 27.3 is an
aerial photograph of a single square mile survey
section (259 ha) in Grand Traverse County, Michigan. The aerial photograph can give clues to the
land use. By overlaying the property boundaries on
the photo, however, land-use interpretation is dramatically improved. In fact, the size of the parcel
may be the characteristic that distinguishes a
413
forested lot used for silviculture versus one used
primarily for residential purposes. Table 27.5 lists
the land-use classification scheme designed for an
ongoing study of the socioeconomic drivers oflanduse change in the upper Midwest. The classification scheme will aid in interpreting the land use of
ownership parcels from aerial photographs.
Another method of land-use mapping involves
"windshield" survey, in which properties are observed from a road and land use is recorded on a
base map of ownership parcels. Also, the U.S. Bureau of the Census (l992a) reports proportions of
various land-use types in each county as part of its
Census of Agriculture. Some aspects of land use,
for example, the intention of the owner or the actual day to day use of the land, can only be determined through surveys or interviews with individuals involved in use of the land.
The section displayed in Figure 27.3 is instructive for a number of reasons. The differences between land use and land cover are evident in the
northern one-half of this I-square-mile survey secTABLE 27.5. Classification of land uses for a study of
land use and cover change in the upper Midwest.
Developed
Residential
High-density residential
Low-density residential
Retail, office
Industrial, warehouse
Infrastructure, transportation
Airport
Transport corridor or terminal
Utility corridor or station
Institutional
Site-based outdoor recreation
Campground
Golf course
Ski area
Marina
Park and outdoor assembly
Mining, extractive
Other developed
Agriculture
Row crop
Nonrow crop
Pasture, grazing
Other agriculture
Undeveloped
Open, grass
Old field, young forest
Mature forest
Tree plantation
Open water
Wetland
Forested wetland
Other undeveloped
Mapped parcels were classified through overlay with and interpretation of aerial photographs.
. .
N
FIGURE 27.3. Black and white infrared aerial photograph
(November 1981) overlain with parcel boundaries (1980)
in white. The area covered is a one-survey section from
Grand Traverse County, Michigan.
soil losses from agricultural fields (Wischmeier and
Smith, 1978). How to quantify management is not
always clear. The incentives for and information
about various management approaches are ever
changing.
Market forces drive land use to a large extent.
Over time, economic individuals use the land to
maximize the value that they can extract from the
land. A variety of federal, state, and local government initiatives has been implemented to affect
land management toward a particular goal (e.g.,
conservation). Although government agencies have
some record of the numbers of people taking advantage of various incentive programs, they rarely
keep spatially referenced (i.e., GIS) databases on
such programs. Egbert et al. (1997) demonstrated
the use of remote sensing to identify the locations
and amount of land that was enrolled in the conservation reserve program (CRP).
Whereas land cover information may be obtained
by satellite remote sensing, information about land
use usually requires much more direct observation.
Aerial photography is an invaluable tool for characterizing land use, but it can rarely be effective in
the absence of other information. Figure 27.3 is an
aerial photograph of a single square mile survey
section (259 ha) in Grand Traverse County, Michigan. The aerial photograph can give clues to the
land use. By overlaying the property boundaries on
the photo, however, land-use interpretation is dramatically improved. In fact, the size of the parcel
may be the characteristic that distinguishes a
413
forested lot used for silviculture versus one used
primarily for residential purposes. Table 27.5 lists
the land-use classification scheme designed for an
ongoing study of the socioeconomic drivers oflanduse change in the upper Midwest. The classification scheme will aid in interpreting the land use of
ownership parcels from aerial photographs.
Another method of land-use mapping involves
"windshield" survey, in which properties are observed from a road and land use is recorded on a
base map of ownership parcels. Also, the U.S. Bureau of the Census (l992a) reports proportions of
various land-use types in each county as part of its
Census of Agriculture. Some aspects of land use,
for example, the intention of the owner or the actual day to day use of the land, can only be determined through surveys or interviews with individuals involved in use of the land.
The section displayed in Figure 27.3 is instructive for a number of reasons. The differences between land use and land cover are evident in the
northern one-half of this I-square-mile survey secTABLE 27.5. Classification of land uses for a study of
land use and cover change in the upper Midwest.
Developed
Residential
High-density residential
Low-density residential
Retail, office
Industrial, warehouse
Infrastructure, transportation
Airport
Transport corridor or terminal
Utility corridor or station
Institutional
Site-based outdoor recreation
Campground
Golf course
Ski area
Marina
Park and outdoor assembly
Mining, extractive
Other developed
Agriculture
Row crop
Nonrow crop
Pasture, grazing
Other agriculture
Undeveloped
Open, grass
Old field, young forest
Mature forest
Tree plantation
Open water
Wetland
Forested wetland
Other undeveloped
Mapped parcels were classified through overlay with and interpretation of aerial photographs.