

13.3 Overview of Approaches in Spatial Analysis
193
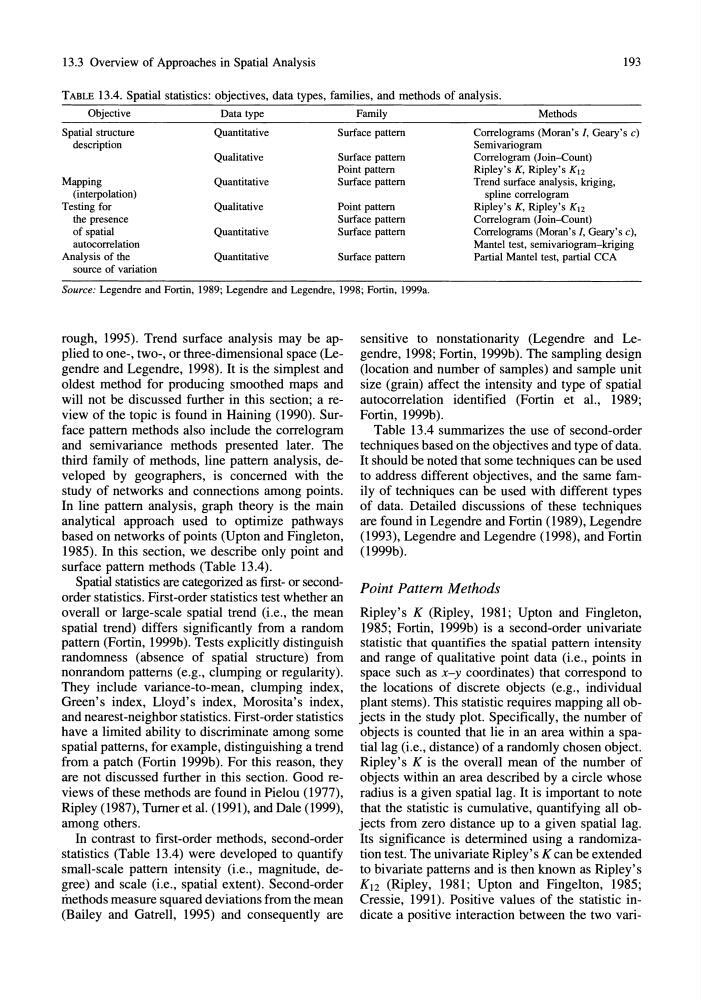
TABLE 13.4. Spatial statistics: objectives, data types, families, and methods of analysis.
Objective
Data type
Family
Methods
Spatial structure
Quantitative
Surface pattern
Correlograms (Moran's I, Geary's c)
description
Semivariogram
Qualitative
Surface pattern
Correlogram (Join-Count)
Point pattern
Ripley's K, Ripley's K12
Mapping
Quantitative
Surface pattern
Trend surface analysis, kriging,
(interpolation)
spline correlogram
Testing for
Qualitative
Point pattern
Ripley's K, Ripley's K12
the presence
Surface pattern
Correlogram (Join-Count)
of spatial
Quantitati ve
Surface pattern
Correlograms (Moran's I, Geary's c),
autocorrelation
Mantel test, semivariogram-kriging
Analysis of the
Quantitative
Surface pattern
Partial Mantel test, partial CCA
source of variation
Source: Legendre and Fortin, 1989; Legendre and Legendre, 1998; Fortin, 1999a.
rough, 1995). Trend surface analysis may be applied to one-, two-, or three-dimensional space (Legendre and Legendre, 1998). It is the simplest and
oldest method for producing smoothed maps and
will not be discussed further in this section; a review of the topic is found in Haining (1990). Surface pattern methods also include the correlogram
and semi variance methods presented later. The
third family of methods, line pattern analysis, developed by geographers, is concerned with the
study of networks and connections among points.
In line pattern analysis, graph theory is the main
analytical approach used to optimize pathways
based on networks of points (Upton and Fingleton,
1985). In this section, we describe only point and
surface pattern methods (Table 13.4).
Spatial statistics are categorized as fIrst- or secondorder statistics. First-order statistics test whether an
overall or large-scale spatial trend (Le., the mean
spatial trend) differs significantly from a random
pattern (Fortin, 1999b). Tests explicitly distinguish
randomness (absence of spatial structure) from
nonrandom patterns (e.g., clumping or regularity).
They include variance-to-mean, clumping index,
Green's index, Lloyd's index, Morosita's index,
and nearest-neighbor statistics. First-order statistics
have a limited ability to discriminate among some
spatial patterns, for example, distinguishing a trend
from a patch (Fortin 1999b). For this reason, they
are not discussed further in this section. Good reviews of these methods are found in Pielou (1977),
Ripley (1987), Turner et al. (1991), and Dale (1999),
among others.
In contrast to first-order methods, second-order
statistics (Table 13.4) were developed to quantify
small-scale pattern intensity (Le., magnitude, degree) and scale (i.e., spatial extent). Second-order
methods measure squared deviations from the mean
(Bailey and Gatrell, 1995) and consequently are
sensitive to nonstationarity (Legendre and Legendre, 1998; Fortin, 1999b). The sampling design
(location and number of samples) and sample unit
size (grain) affect the intensity and type of spatial
autocorrelation identifIed (Fortin et aI., 1989;
Fortin, 1999b).
Table 13.4 summarizes the use of second-order
techniques based on the objectives and type of data.
It should be noted that some techniques can be used
to address different objectives, and the same family of techniques can be used with different types
of data. Detailed discussions of these techniques
are found in Legendre and Fortin (1989), Legendre
(1993), Legendre and Legendre (1998), and Fortin
(1999b).
Point Pattern Methods
Ripley's K (Ripley, 1981; Upton and Fingleton,
1985; Fortin, 1999b) is a second-order univariate
statistic that quantifies the spatial pattern intensity
and range of qualitative point data (i.e., points in
space such as x-y coordinates) that correspond to
the locations of discrete objects (e.g., individual
plant stems). This statistic requires mapping all objects in the study plot. Specifically, the number of
objects is counted that lie in an area within a spatiallag (i.e., distance) of a randomly chosen object.
Ripley's K is the overall mean of the number of
objects within an area described by a circle whose
radius is a given spatial lag. It is important to note
that the statistic is cumulative, quantifying all objects from zero distance up to a given spatial lag.
Its significance is determined using a randomization test. The univariate Ripley's K can be extended
to bivariate patterns and is then known as Ripley's
K12 (Ripley, 1981; Upton and Fingelton, 1985;
Cress ie, 1991). Positive values of the statistic indicate a positive interaction between the two vari-
193
TABLE 13.4. Spatial statistics: objectives, data types, families, and methods of analysis.
Objective
Data type
Family
Methods
Spatial structure
Quantitative
Surface pattern
Correlograms (Moran's I, Geary's c)
description
Semivariogram
Qualitative
Surface pattern
Correlogram (Join-Count)
Point pattern
Ripley's K, Ripley's K12
Mapping
Quantitative
Surface pattern
Trend surface analysis, kriging,
(interpolation)
spline correlogram
Testing for
Qualitative
Point pattern
Ripley's K, Ripley's K12
the presence
Surface pattern
Correlogram (Join-Count)
of spatial
Quantitati ve
Surface pattern
Correlograms (Moran's I, Geary's c),
autocorrelation
Mantel test, semivariogram-kriging
Analysis of the
Quantitative
Surface pattern
Partial Mantel test, partial CCA
source of variation
Source: Legendre and Fortin, 1989; Legendre and Legendre, 1998; Fortin, 1999a.
rough, 1995). Trend surface analysis may be applied to one-, two-, or three-dimensional space (Legendre and Legendre, 1998). It is the simplest and
oldest method for producing smoothed maps and
will not be discussed further in this section; a review of the topic is found in Haining (1990). Surface pattern methods also include the correlogram
and semi variance methods presented later. The
third family of methods, line pattern analysis, developed by geographers, is concerned with the
study of networks and connections among points.
In line pattern analysis, graph theory is the main
analytical approach used to optimize pathways
based on networks of points (Upton and Fingleton,
1985). In this section, we describe only point and
surface pattern methods (Table 13.4).
Spatial statistics are categorized as fIrst- or secondorder statistics. First-order statistics test whether an
overall or large-scale spatial trend (Le., the mean
spatial trend) differs significantly from a random
pattern (Fortin, 1999b). Tests explicitly distinguish
randomness (absence of spatial structure) from
nonrandom patterns (e.g., clumping or regularity).
They include variance-to-mean, clumping index,
Green's index, Lloyd's index, Morosita's index,
and nearest-neighbor statistics. First-order statistics
have a limited ability to discriminate among some
spatial patterns, for example, distinguishing a trend
from a patch (Fortin 1999b). For this reason, they
are not discussed further in this section. Good reviews of these methods are found in Pielou (1977),
Ripley (1987), Turner et al. (1991), and Dale (1999),
among others.
In contrast to first-order methods, second-order
statistics (Table 13.4) were developed to quantify
small-scale pattern intensity (Le., magnitude, degree) and scale (i.e., spatial extent). Second-order
methods measure squared deviations from the mean
(Bailey and Gatrell, 1995) and consequently are
sensitive to nonstationarity (Legendre and Legendre, 1998; Fortin, 1999b). The sampling design
(location and number of samples) and sample unit
size (grain) affect the intensity and type of spatial
autocorrelation identifIed (Fortin et aI., 1989;
Fortin, 1999b).
Table 13.4 summarizes the use of second-order
techniques based on the objectives and type of data.
It should be noted that some techniques can be used
to address different objectives, and the same family of techniques can be used with different types
of data. Detailed discussions of these techniques
are found in Legendre and Fortin (1989), Legendre
(1993), Legendre and Legendre (1998), and Fortin
(1999b).
Point Pattern Methods
Ripley's K (Ripley, 1981; Upton and Fingleton,
1985; Fortin, 1999b) is a second-order univariate
statistic that quantifies the spatial pattern intensity
and range of qualitative point data (i.e., points in
space such as x-y coordinates) that correspond to
the locations of discrete objects (e.g., individual
plant stems). This statistic requires mapping all objects in the study plot. Specifically, the number of
objects is counted that lie in an area within a spatiallag (i.e., distance) of a randomly chosen object.
Ripley's K is the overall mean of the number of
objects within an area described by a circle whose
radius is a given spatial lag. It is important to note
that the statistic is cumulative, quantifying all objects from zero distance up to a given spatial lag.
Its significance is determined using a randomization test. The univariate Ripley's K can be extended
to bivariate patterns and is then known as Ripley's
K12 (Ripley, 1981; Upton and Fingelton, 1985;
Cress ie, 1991). Positive values of the statistic indicate a positive interaction between the two vari-