

11.4 Data Sources
155
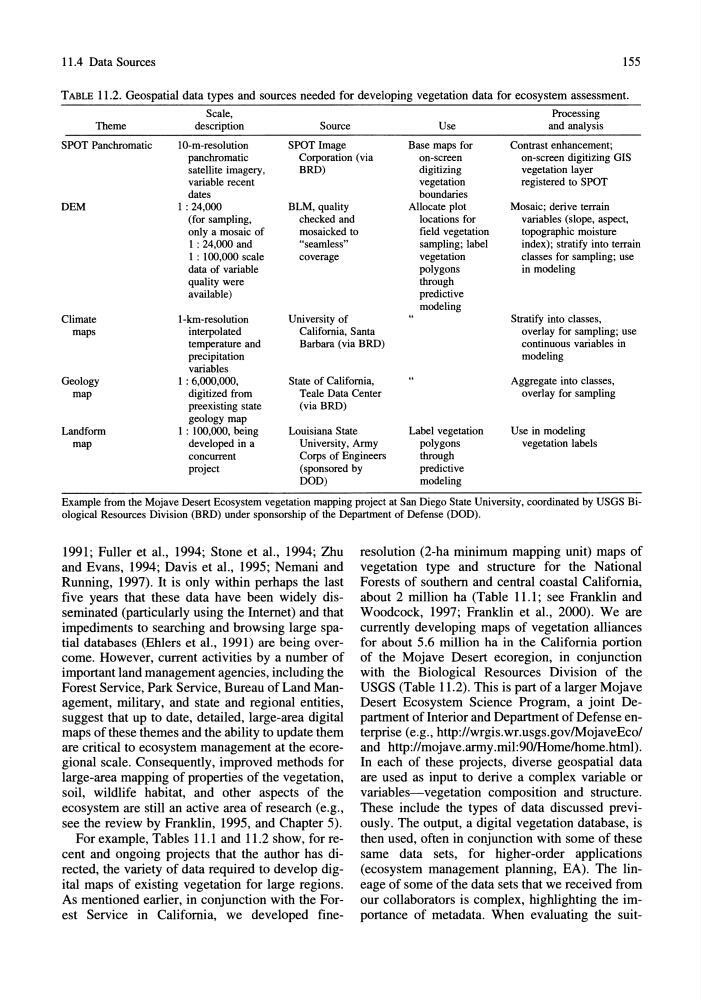
TABLE 11.2. Geospatial data types and sources needed for developing vegetation data for ecosystem assessment.
Scale,
Processing
Theme
description
Source
Use
and analysis
SPOT Panchromatic
10-m-resolution
SPOT Image
Base maps for
Contrast enhancement;
panchromatic
Corporation (via
on-screen
on-screen digitizing GIS
satellite imagery,
BRD)
digitizing
vegetation layer
variable recent
vegetation
registered to SPOT
dates
boundaries
DEM
I: 24,000
BLM, quality
Allocate plot
Mosaic; derive terrain
(for sampling,
checked and
locations for
variables (slope, aspect,
only a mosaic of
mosaicked to
field vegetation
topographic moisture
I : 24,000 and
"seamless"
sampling; label
index); stratify into terrain
I : 100,000 scale
coverage
vegetation
classes for sampling; use
data of variable
polygons
in modeling
quality were
through
available)
predictive
modeling
Climate
I-km-resolution
University of
Stratify into classes,
maps
interpolated
California, Santa
overlay for sampling; use
temperature and
Barbara (via BRD)
continuous variables in
precipitation
modeling
variables
Geology
I : 6,000,000,
S tate of California,
Aggregate into classes,
map
digitized from
Teale Data Center
overlay for sampling
preexisting state
(via BRD)
geology map
Landform
I : 100,000, being
Louisiana State
Label vegetation
Use in modeling
map
developed in a
University, Army
polygons
vegetation labels
concurrent
Corps of Engineers
through
project
(sponsored by
predictive
DOD)
modeling
Example from the Mojave Desert Ecosystem vegetation mapping project at San Diego State University, coordinated by USGS Biological Resources Division (BRD) under sponsorship of the Department of Defense (DOD).
1991; Fuller et aI., 1994; Stone et ai., 1994; Zhu
and Evans, 1994; Davis et al., 1995; Nemani and
Running, 1997). It is only within perhaps the last
five years that these data have been widely disseminated (particularly using the Internet) and that
impediments to searching and browsing large spatial databases (Ehlers et al., 1991) are being overcome. However, current activities by a number of
important land management agencies, including the
Forest Service, Park Service, Bureau of Land Management, military, and state and regional entities,
suggest that up to date, detailed, large-area digital
maps of these themes and the ability to update them
are critical to ecosystem management at the ecoregional scale. Consequently, improved methods for
large-area mapping of properties of the vegetation,
soil, wildlife habitat, and other aspects of the
ecosystem are still an active area of research (e.g.,
see the review by Franklin, 1995, and Chapter 5).
For example, Tables 11.1 and 11.2 show, for recent and ongoing projects that the author has directed, the variety of data required to develop digital maps of existing vegetation for large regions.
As mentioned earlier, in conjunction with the Forest Service in California, we developed fineresolution (2-ha minimum mapping unit) maps of
vegetation type and structure for the National
Forests of southern and central coastal California,
about 2 million ha (Table 11.1; see Franklin and
Woodcock, 1997; Franklin et aI., 2000). We are
currently developing maps of vegetation alliances
for about 5.6 million ha in the California portion
of the Mojave Desert ecoregion, in conjunction
with the Biological Resources Division of the
USGS (Table 11.2). This is part of a larger Mojave
Desert Ecosystem Science Program, a joint Department of Interior and Department of Defense enterprise (e.g., http://wrgis.wr.usgs.gov/MojaveEco/
and http://mojave.army.mil:90/Home/home.html).
In each of these projects, diverse geospatial data
are used as input to derive a complex variable or
variables-vegetation composition and structure.
These include the types of data discussed previously. The output, a digital vegetation database, is
then used, often in conjunction with some of these
same data sets, for higher-order applications
(ecosystem management planning, EA). The lineage of some of the data sets that we received from
our collaborators is complex, highlighting the importance of metadata. When evaluating the suit-
155
TABLE 11.2. Geospatial data types and sources needed for developing vegetation data for ecosystem assessment.
Scale,
Processing
Theme
description
Source
Use
and analysis
SPOT Panchromatic
10-m-resolution
SPOT Image
Base maps for
Contrast enhancement;
panchromatic
Corporation (via
on-screen
on-screen digitizing GIS
satellite imagery,
BRD)
digitizing
vegetation layer
variable recent
vegetation
registered to SPOT
dates
boundaries
DEM
I: 24,000
BLM, quality
Allocate plot
Mosaic; derive terrain
(for sampling,
checked and
locations for
variables (slope, aspect,
only a mosaic of
mosaicked to
field vegetation
topographic moisture
I : 24,000 and
"seamless"
sampling; label
index); stratify into terrain
I : 100,000 scale
coverage
vegetation
classes for sampling; use
data of variable
polygons
in modeling
quality were
through
available)
predictive
modeling
Climate
I-km-resolution
University of
Stratify into classes,
maps
interpolated
California, Santa
overlay for sampling; use
temperature and
Barbara (via BRD)
continuous variables in
precipitation
modeling
variables
Geology
I : 6,000,000,
S tate of California,
Aggregate into classes,
map
digitized from
Teale Data Center
overlay for sampling
preexisting state
(via BRD)
geology map
Landform
I : 100,000, being
Louisiana State
Label vegetation
Use in modeling
map
developed in a
University, Army
polygons
vegetation labels
concurrent
Corps of Engineers
through
project
(sponsored by
predictive
DOD)
modeling
Example from the Mojave Desert Ecosystem vegetation mapping project at San Diego State University, coordinated by USGS Biological Resources Division (BRD) under sponsorship of the Department of Defense (DOD).
1991; Fuller et aI., 1994; Stone et ai., 1994; Zhu
and Evans, 1994; Davis et al., 1995; Nemani and
Running, 1997). It is only within perhaps the last
five years that these data have been widely disseminated (particularly using the Internet) and that
impediments to searching and browsing large spatial databases (Ehlers et al., 1991) are being overcome. However, current activities by a number of
important land management agencies, including the
Forest Service, Park Service, Bureau of Land Management, military, and state and regional entities,
suggest that up to date, detailed, large-area digital
maps of these themes and the ability to update them
are critical to ecosystem management at the ecoregional scale. Consequently, improved methods for
large-area mapping of properties of the vegetation,
soil, wildlife habitat, and other aspects of the
ecosystem are still an active area of research (e.g.,
see the review by Franklin, 1995, and Chapter 5).
For example, Tables 11.1 and 11.2 show, for recent and ongoing projects that the author has directed, the variety of data required to develop digital maps of existing vegetation for large regions.
As mentioned earlier, in conjunction with the Forest Service in California, we developed fineresolution (2-ha minimum mapping unit) maps of
vegetation type and structure for the National
Forests of southern and central coastal California,
about 2 million ha (Table 11.1; see Franklin and
Woodcock, 1997; Franklin et aI., 2000). We are
currently developing maps of vegetation alliances
for about 5.6 million ha in the California portion
of the Mojave Desert ecoregion, in conjunction
with the Biological Resources Division of the
USGS (Table 11.2). This is part of a larger Mojave
Desert Ecosystem Science Program, a joint Department of Interior and Department of Defense enterprise (e.g., http://wrgis.wr.usgs.gov/MojaveEco/
and http://mojave.army.mil:90/Home/home.html).
In each of these projects, diverse geospatial data
are used as input to derive a complex variable or
variables-vegetation composition and structure.
These include the types of data discussed previously. The output, a digital vegetation database, is
then used, often in conjunction with some of these
same data sets, for higher-order applications
(ecosystem management planning, EA). The lineage of some of the data sets that we received from
our collaborators is complex, highlighting the importance of metadata. When evaluating the suit-