

10.4 Remote Sensing and Ecosystem Management Examples
143
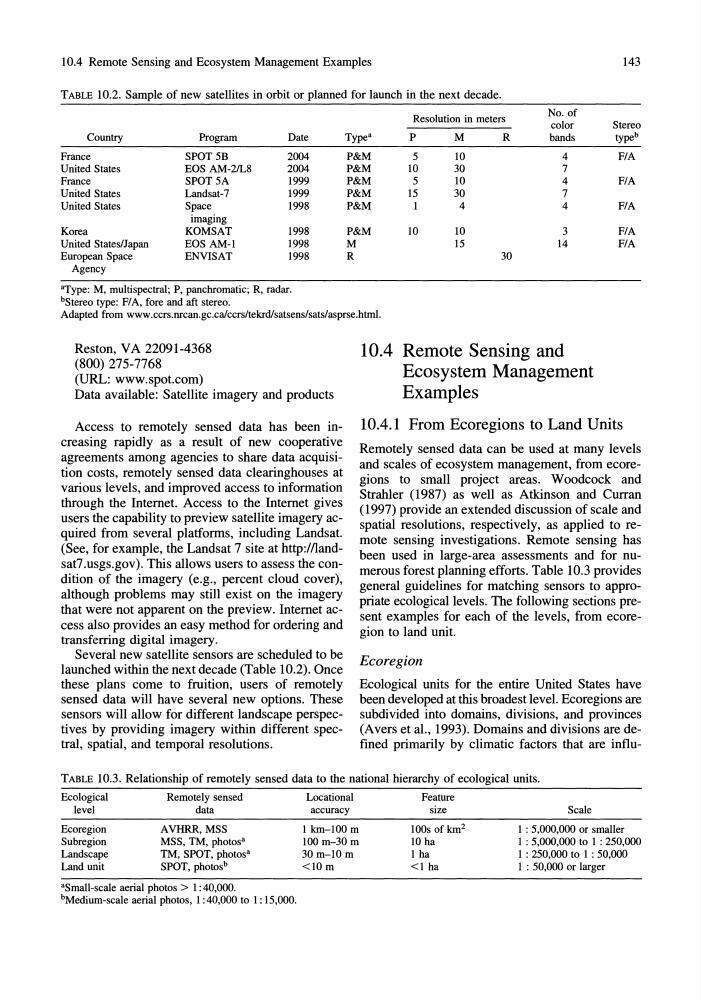
TABLE 10.2. Sample of new satellites in orbit or planned for launch in the next decade.
Country
Program
Date
France
SPOT 5B
2004
United States
EOS AM-21L8
2004
France
SPOT 5A
1999
United States
Landsat-7
1999
United States
Space
1998
imaging
Korea
KOMSAT
1998
United States/Japan
EOS AM-I
1998
European Space
ENVISAT
1998
Agency
'Type: M, multispectral; P, panchromatic; R, radar.
bStereo type: F/ A, fore and aft stereo.
Type'
P&M
P&M
P&M
P&M
P&M
P&M
M
R
No. of
color
Stereo
Resolution in meters
P
M
R
bands
type b
5
10
4
F/A
10
30
7
5
10
4
F/A
15
30
7
I
4
4
F/A
10
10
3
F/A
15
14
F/A
30
Adapted from www.ccrs.nrcan.gc.ca/ccrs/tekrdlsatsens/sats/asprse.html.
Reston, VA 22091-4368
(800) 275-7768
(URL: www.spot.com)
Data available: Satellite imagery and products
Access to remotely sensed data has been increasing rapidly as a result of new cooperative
agreements among agencies to share data acquisition costs, remotely sensed data clearinghouses at
various levels, and improved access to information
through the Internet. Access to the Internet gives
users the capability to preview satellite imagery acquired from several platforms, including Landsat.
(See, for example, the Landsat 7 site at http://landsat7.usgs.gov). This allows users to assess the condition of the imagery (e.g., percent cloud cover),
although problems may still exist on the imagery
that were not apparent on the preview. Internet access also provides an easy method for ordering and
transferring digital imagery.
Several new satellite sensors are scheduled to be
launched within the next decade (Table 10.2). Once
these plans come to fruition, users of remotely
sensed data will have several new options. These
sensors will allow for different landscape perspectives by providing imagery within different spectral, spatial, and temporal resolutions.
10.4 Remote Sensing and
Ecosystem Management
Examples
10.4.1 From Ecoregions to Land Units
Remotely sensed data can be used at many levels
and scales of ecosystem management, from ecoregions to small project areas. Woodcock and
Strahler (1987) as well as Atkinson and Curran
(1997) provide an extended discussion of scale and
spatial resolutions, respectively, as applied to remote sensing investigations. Remote sensing has
been used in large-area assessments and for numerous forest planning efforts. Table 10.3 provides
general guidelines for matching sensors to appropriate ecological levels. The following sections present examples for each of the levels, from ecoregion to land unit.
Ecoregion
Ecological units for the entire United States have
been developed at this broadest level. Ecoregions are
subdivided into domains, divisions, and provinces
(Avers et aI., 1993). Domains and divisions are defined primarily by climatic factors that are influTABLE 10.3. Relationship of remotely sensed data to the national hierarchy of ecological units.
Ecological
level
Ecoregion
Subregion
Landscape
Land unit
Remotely sensed
data
AVHRR,MSS
MSS, TM, photos'
TM, SPOT, photos'
SPOT, photos b
'Small-scale aerial photos> 1: 40,000.
bMedium-scale aerial photos, I :40,000 to I: 15,000.
Locational
accuracy
I krn-IOO m
100 m-30m
30 m-IO m
<10m
Feature
size
100s of km 2
10 ha
1 ha
<1 ha
Scale
I : 5,000,000 or smaller
I : 5,000,000 to I : 250,000
I : 250,000 to I : 50,000
I : 50,000 or larger
143
TABLE 10.2. Sample of new satellites in orbit or planned for launch in the next decade.
Country
Program
Date
France
SPOT 5B
2004
United States
EOS AM-21L8
2004
France
SPOT 5A
1999
United States
Landsat-7
1999
United States
Space
1998
imaging
Korea
KOMSAT
1998
United States/Japan
EOS AM-I
1998
European Space
ENVISAT
1998
Agency
'Type: M, multispectral; P, panchromatic; R, radar.
bStereo type: F/ A, fore and aft stereo.
Type'
P&M
P&M
P&M
P&M
P&M
P&M
M
R
No. of
color
Stereo
Resolution in meters
P
M
R
bands
type b
5
10
4
F/A
10
30
7
5
10
4
F/A
15
30
7
I
4
4
F/A
10
10
3
F/A
15
14
F/A
30
Adapted from www.ccrs.nrcan.gc.ca/ccrs/tekrdlsatsens/sats/asprse.html.
Reston, VA 22091-4368
(800) 275-7768
(URL: www.spot.com)
Data available: Satellite imagery and products
Access to remotely sensed data has been increasing rapidly as a result of new cooperative
agreements among agencies to share data acquisition costs, remotely sensed data clearinghouses at
various levels, and improved access to information
through the Internet. Access to the Internet gives
users the capability to preview satellite imagery acquired from several platforms, including Landsat.
(See, for example, the Landsat 7 site at http://landsat7.usgs.gov). This allows users to assess the condition of the imagery (e.g., percent cloud cover),
although problems may still exist on the imagery
that were not apparent on the preview. Internet access also provides an easy method for ordering and
transferring digital imagery.
Several new satellite sensors are scheduled to be
launched within the next decade (Table 10.2). Once
these plans come to fruition, users of remotely
sensed data will have several new options. These
sensors will allow for different landscape perspectives by providing imagery within different spectral, spatial, and temporal resolutions.
10.4 Remote Sensing and
Ecosystem Management
Examples
10.4.1 From Ecoregions to Land Units
Remotely sensed data can be used at many levels
and scales of ecosystem management, from ecoregions to small project areas. Woodcock and
Strahler (1987) as well as Atkinson and Curran
(1997) provide an extended discussion of scale and
spatial resolutions, respectively, as applied to remote sensing investigations. Remote sensing has
been used in large-area assessments and for numerous forest planning efforts. Table 10.3 provides
general guidelines for matching sensors to appropriate ecological levels. The following sections present examples for each of the levels, from ecoregion to land unit.
Ecoregion
Ecological units for the entire United States have
been developed at this broadest level. Ecoregions are
subdivided into domains, divisions, and provinces
(Avers et aI., 1993). Domains and divisions are defined primarily by climatic factors that are influTABLE 10.3. Relationship of remotely sensed data to the national hierarchy of ecological units.
Ecological
level
Ecoregion
Subregion
Landscape
Land unit
Remotely sensed
data
AVHRR,MSS
MSS, TM, photos'
TM, SPOT, photos'
SPOT, photos b
'Small-scale aerial photos> 1: 40,000.
bMedium-scale aerial photos, I :40,000 to I: 15,000.
Locational
accuracy
I krn-IOO m
100 m-30m
30 m-IO m
<10m
Feature
size
100s of km 2
10 ha
1 ha
<1 ha
Scale
I : 5,000,000 or smaller
I : 5,000,000 to I : 250,000
I : 250,000 to I : 50,000
I : 50,000 or larger