

100
General Data Collection and Sampling Design Considerations
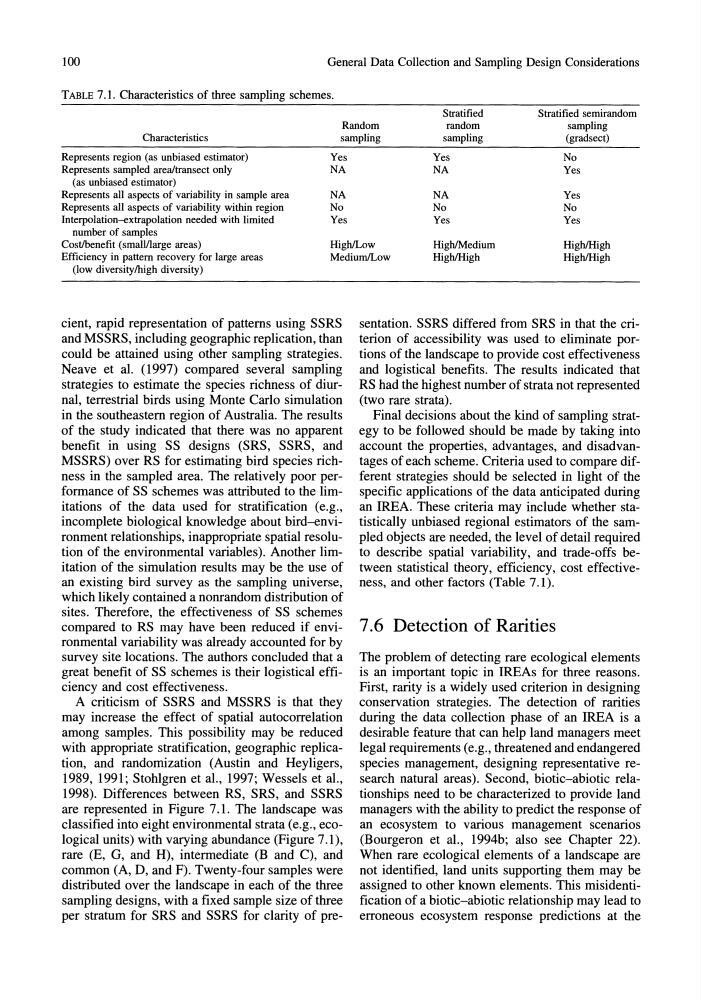
TABLE 7.1. Characteristics of three sampling schemes.
Characteristics
Random
sampling
Stratified
random
sampling
Stratified semirandom
sampling
(gradsect)
Represents region (as unbiased estimator)
Represents sampled area/transect only
(as unbiased estimator)
Represents all aspects of variability in sample area
Represents all aspects of variability within region
Interpolation--extrapolation needed with limited
Yes
NA
NA
No
Yes
Yes
NA
NA
No
Yes
No
Yes
Yes
No
Yes
number of samples
Costlbenefit (smallJlarge areas)
Efficiency in pattern recovery for large areas
(low diversitylhigh diversity)
HighILow
MediumILow
High/Medium
HighIHigh
HighIHigh
HighIHigh
cient, rapid representation of patterns using SSRS
and MSSRS, including geographic replication, than
could be attained using other sampling strategies.
Neave et ai. (1997) compared several sampling
strategies to estimate the species richness of diurnal, terrestrial birds using Monte Carlo simulation
in the southeastern region of Australia. The results
of the study indicated that there was no apparent
benefit in using SS designs (SRS, SSRS, and
MSSRS) over RS for estimating bird species richness in the sampled area. The relatively poor performance of SS schemes was attributed to the limitations of the data used for stratification (e.g.,
incomplete biological knowledge about bird-environment relationships, inappropriate spatial resolution of the environmental variables). Another limitation of the simulation results may be the use of
an existing bird survey as the sampling universe,
which likely contained a nonrandom distribution of
sites. Therefore, the effectiveness of SS schemes
compared to RS may have been reduced if environmental variability was already accounted for by
survey site locations. The authors concluded that a
great benefit of SS schemes is their logistical efficiency and cost effectiveness.
A criticism of SSRS and MSSRS is that they
may increase the effect of spatial autocorrelation
among samples. This possibility may be reduced
with appropriate stratification, geographic replication, and randomization (Austin and Heyligers,
1989, 1991; Stohlgren et aI., 1997; Wessels et aI.,
1998). Differences between RS, SRS, and SSRS
are represented in Figure 7.1. The landscape was
classified into eight environmental strata (e.g., ecological units) with varying abundance (Figure 7.1),
rare (E, G, and H), intermediate (B and C), and
common (A, D, and F). Twenty-four samples were
distributed over the landscape in each of the three
sampling designs, with a fixed sample size of three
per stratum for SRS and SSRS for clarity of presentation. SSRS differed from SRS in that the criterion of accessibility was used to eliminate portions of the landscape to provide cost effectiveness
and logistical benefits. The results indicated that
RS had the highest number of strata not represented
(two rare strata).
Final decisions about the kind of sampling strategy to be followed should be made by taking into
account the properties, advantages, and disadvantages of each scheme. Criteria used to compare different strategies should be selected in light of the
specific applications of the data anticipated during
an IREA. These criteria may include whether statistically unbiased regional estimators of the sampled objects are needed, the level of detail required
to describe spatial variability, and trade-offs between statistical theory, efficiency, cost effectiveness, and other factors (Table 7.1).
7.6 Detection of Rarities
The problem of detecting rare ecological elements
is an important topic in IREAs for three reasons.
First, rarity is a widely used criterion in designing
conservation strategies. The detection of rarities
during the data collection phase of an lREA is a
desirable feature that can help land managers meet
legal requirements (e.g., threatened and endangered
species management, designing representative research natural areas). Second, biotic-abiotic relationships need to be characterized to provide land
managers with the ability to predict the response of
an ecosystem to various management scenarios
(Bourgeron et aI., 1994b; also see Chapter 22).
When rare ecological elements of a landscape are
not identified, land units supporting them may be
assigned to other known elements. This misidentification of a biotic-abiotic relationship may lead to
erroneous ecosystem response predictions at the
General Data Collection and Sampling Design Considerations
TABLE 7.1. Characteristics of three sampling schemes.
Characteristics
Random
sampling
Stratified
random
sampling
Stratified semirandom
sampling
(gradsect)
Represents region (as unbiased estimator)
Represents sampled area/transect only
(as unbiased estimator)
Represents all aspects of variability in sample area
Represents all aspects of variability within region
Interpolation--extrapolation needed with limited
Yes
NA
NA
No
Yes
Yes
NA
NA
No
Yes
No
Yes
Yes
No
Yes
number of samples
Costlbenefit (smallJlarge areas)
Efficiency in pattern recovery for large areas
(low diversitylhigh diversity)
HighILow
MediumILow
High/Medium
HighIHigh
HighIHigh
HighIHigh
cient, rapid representation of patterns using SSRS
and MSSRS, including geographic replication, than
could be attained using other sampling strategies.
Neave et ai. (1997) compared several sampling
strategies to estimate the species richness of diurnal, terrestrial birds using Monte Carlo simulation
in the southeastern region of Australia. The results
of the study indicated that there was no apparent
benefit in using SS designs (SRS, SSRS, and
MSSRS) over RS for estimating bird species richness in the sampled area. The relatively poor performance of SS schemes was attributed to the limitations of the data used for stratification (e.g.,
incomplete biological knowledge about bird-environment relationships, inappropriate spatial resolution of the environmental variables). Another limitation of the simulation results may be the use of
an existing bird survey as the sampling universe,
which likely contained a nonrandom distribution of
sites. Therefore, the effectiveness of SS schemes
compared to RS may have been reduced if environmental variability was already accounted for by
survey site locations. The authors concluded that a
great benefit of SS schemes is their logistical efficiency and cost effectiveness.
A criticism of SSRS and MSSRS is that they
may increase the effect of spatial autocorrelation
among samples. This possibility may be reduced
with appropriate stratification, geographic replication, and randomization (Austin and Heyligers,
1989, 1991; Stohlgren et aI., 1997; Wessels et aI.,
1998). Differences between RS, SRS, and SSRS
are represented in Figure 7.1. The landscape was
classified into eight environmental strata (e.g., ecological units) with varying abundance (Figure 7.1),
rare (E, G, and H), intermediate (B and C), and
common (A, D, and F). Twenty-four samples were
distributed over the landscape in each of the three
sampling designs, with a fixed sample size of three
per stratum for SRS and SSRS for clarity of presentation. SSRS differed from SRS in that the criterion of accessibility was used to eliminate portions of the landscape to provide cost effectiveness
and logistical benefits. The results indicated that
RS had the highest number of strata not represented
(two rare strata).
Final decisions about the kind of sampling strategy to be followed should be made by taking into
account the properties, advantages, and disadvantages of each scheme. Criteria used to compare different strategies should be selected in light of the
specific applications of the data anticipated during
an IREA. These criteria may include whether statistically unbiased regional estimators of the sampled objects are needed, the level of detail required
to describe spatial variability, and trade-offs between statistical theory, efficiency, cost effectiveness, and other factors (Table 7.1).
7.6 Detection of Rarities
The problem of detecting rare ecological elements
is an important topic in IREAs for three reasons.
First, rarity is a widely used criterion in designing
conservation strategies. The detection of rarities
during the data collection phase of an lREA is a
desirable feature that can help land managers meet
legal requirements (e.g., threatened and endangered
species management, designing representative research natural areas). Second, biotic-abiotic relationships need to be characterized to provide land
managers with the ability to predict the response of
an ecosystem to various management scenarios
(Bourgeron et aI., 1994b; also see Chapter 22).
When rare ecological elements of a landscape are
not identified, land units supporting them may be
assigned to other known elements. This misidentification of a biotic-abiotic relationship may lead to
erroneous ecosystem response predictions at the