

0
5
10
15
20
25
30
0
5
10
15
IndVal-optimal number of clusters
k (number of clusters)
IndVal sum
optimum
2
a
0
5
10
15
20
25
30
0.0
0.2
0.4
0.6
0.8
1.0
Proportion of clusters with significant indicator species
k (number of clusters)
Ratio
optimum
2
b
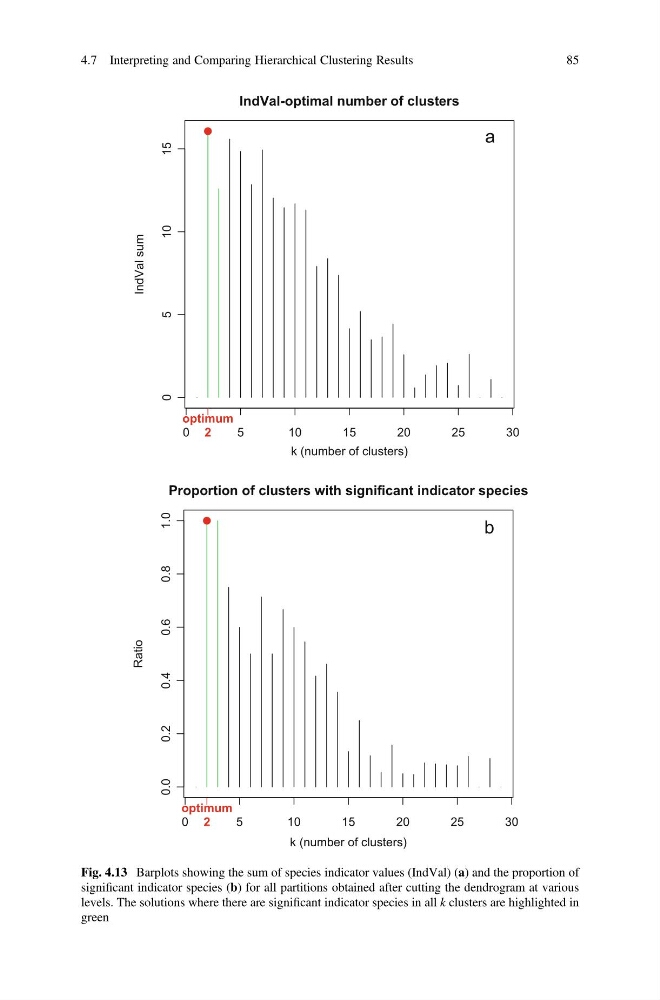
Fig. 4.13 Barplots showing the sum of species indicator values (IndVal) (a) and the proportion of
significant indicator species (b) for all partitions obtained after cutting the dendrogram at various
levels. The solutions where there are significant indicator species in all k clusters are highlighted in
green
4.7 Interpreting and Comparing Hierarchical Clustering Results
85
5
10
15
20
25
30
0
5
10
15
IndVal-optimal number of clusters
k (number of clusters)
IndVal sum
optimum
2
a
0
5
10
15
20
25
30
0.0
0.2
0.4
0.6
0.8
1.0
Proportion of clusters with significant indicator species
k (number of clusters)
Ratio
optimum
2
b
Fig. 4.13 Barplots showing the sum of species indicator values (IndVal) (a) and the proportion of
significant indicator species (b) for all partitions obtained after cutting the dendrogram at various
levels. The solutions where there are significant indicator species in all k clusters are highlighted in
green
4.7 Interpreting and Comparing Hierarchical Clustering Results
85