

8.5.2 Beta Taxonomic, Phylogenetic and Functional Diversities
A unified framework for computing community diversity indices according to
different facets (taxonomic [generally at the species level], phylogenetic and functional) and spatial components (alpha, beta, gamma) was proposed by de Bello et al.
(2010). It is based on the “Rao quadratic entropy” or quadratic diversity index Q
(Rao 1982), computed as the sum of the dissimilarities between all possible pairs of
species, weighted by the product of species proportions:
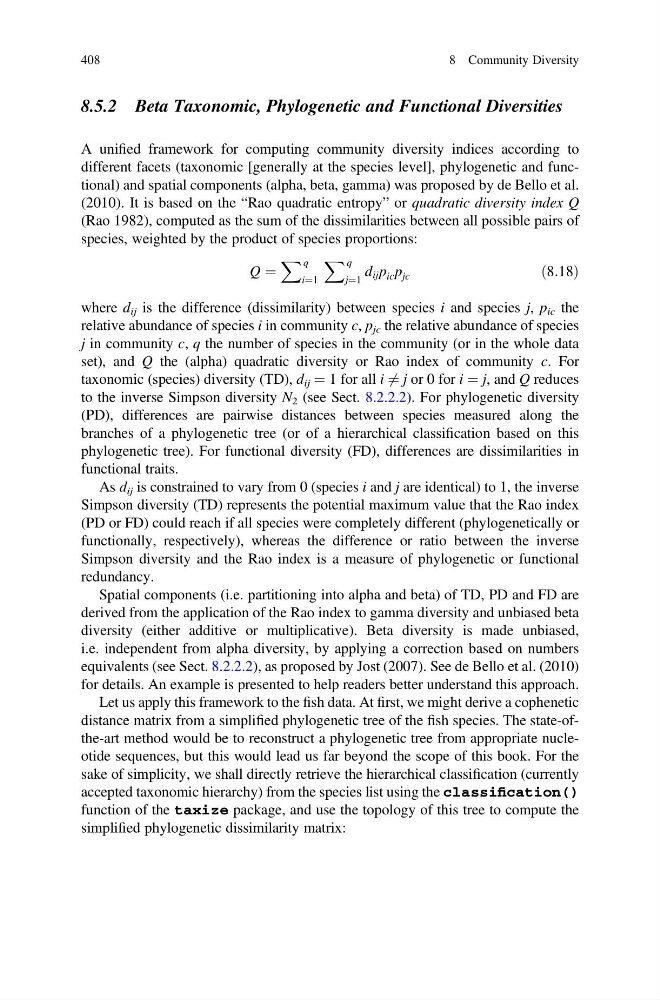
Q ¼
X q
i¼1
X q
j¼1
d ij p ic p jc
ð8:18Þ
where d ij is the difference (dissimilarity) between species i and species j, p ic the
relative abundance of species i in community c, p jc the relative abundance of species
j in community c, q the number of species in the community (or in the whole data
set), and Q the (alpha) quadratic diversity or Rao index of community c. For
taxonomic (species) diversity (TD), d ij ¼ 1 for all i 6 ¼ j or 0 for i ¼ j, and Q reduces
to the inverse Simpson diversity N 2 (see Sect. 8.2.2.2). For phylogenetic diversity
(PD), differences are pairwise distances between species measured along the
branches of a phylogenetic tree (or of a hierarchical classification based on this
phylogenetic tree). For functional diversity (FD), differences are dissimilarities in
functional traits.
As d ij is constrained to vary from 0 (species i and j are identical) to 1, the inverse
Simpson diversity (TD) represents the potential maximum value that the Rao index
(PD or FD) could reach if all species were completely different (phylogenetically or
functionally, respectively), whereas the difference or ratio between the inverse
Simpson diversity and the Rao index is a measure of phylogenetic or functional
redundancy.
Spatial components (i.e. partitioning into alpha and beta) of TD, PD and FD are
derived from the application of the Rao index to gamma diversity and unbiased beta
diversity (either additive or multiplicative). Beta diversity is made unbiased,
i.e. independent from alpha diversity, by applying a correction based on numbers
equivalents (see Sect. 8.2.2.2), as proposed by Jost (2007). See de Bello et al. (2010)
for details. An example is presented to help readers better understand this approach.
Let us apply this framework to the fish data. At first, we might derive a cophenetic
distance matrix from a simplified phylogenetic tree of the fish species. The state-ofthe-art method would be to reconstruct a phylogenetic tree from appropriate nucleotide sequences, but this would lead us far beyond the scope of this book. For the
sake of simplicity, we shall directly retrieve the hierarchical classification (currently
accepted taxonomic hierarchy) from the species list using the classification()
function of the taxize package, and use the topology of this tree to compute the
simplified phylogenetic dissimilarity matrix:
408
8 Community Diversity
A unified framework for computing community diversity indices according to
different facets (taxonomic [generally at the species level], phylogenetic and functional) and spatial components (alpha, beta, gamma) was proposed by de Bello et al.
(2010). It is based on the “Rao quadratic entropy” or quadratic diversity index Q
(Rao 1982), computed as the sum of the dissimilarities between all possible pairs of
species, weighted by the product of species proportions:
Q ¼
X q
i¼1
X q
j¼1
d ij p ic p jc
ð8:18Þ
where d ij is the difference (dissimilarity) between species i and species j, p ic the
relative abundance of species i in community c, p jc the relative abundance of species
j in community c, q the number of species in the community (or in the whole data
set), and Q the (alpha) quadratic diversity or Rao index of community c. For
taxonomic (species) diversity (TD), d ij ¼ 1 for all i 6 ¼ j or 0 for i ¼ j, and Q reduces
to the inverse Simpson diversity N 2 (see Sect. 8.2.2.2). For phylogenetic diversity
(PD), differences are pairwise distances between species measured along the
branches of a phylogenetic tree (or of a hierarchical classification based on this
phylogenetic tree). For functional diversity (FD), differences are dissimilarities in
functional traits.
As d ij is constrained to vary from 0 (species i and j are identical) to 1, the inverse
Simpson diversity (TD) represents the potential maximum value that the Rao index
(PD or FD) could reach if all species were completely different (phylogenetically or
functionally, respectively), whereas the difference or ratio between the inverse
Simpson diversity and the Rao index is a measure of phylogenetic or functional
redundancy.
Spatial components (i.e. partitioning into alpha and beta) of TD, PD and FD are
derived from the application of the Rao index to gamma diversity and unbiased beta
diversity (either additive or multiplicative). Beta diversity is made unbiased,
i.e. independent from alpha diversity, by applying a correction based on numbers
equivalents (see Sect. 8.2.2.2), as proposed by Jost (2007). See de Bello et al. (2010)
for details. An example is presented to help readers better understand this approach.
Let us apply this framework to the fish data. At first, we might derive a cophenetic
distance matrix from a simplified phylogenetic tree of the fish species. The state-ofthe-art method would be to reconstruct a phylogenetic tree from appropriate nucleotide sequences, but this would lead us far beyond the scope of this book. For the
sake of simplicity, we shall directly retrieve the hierarchical classification (currently
accepted taxonomic hierarchy) from the species list using the classification()
function of the taxize package, and use the topology of this tree to compute the
simplified phylogenetic dissimilarity matrix:
408
8 Community Diversity