

richness in sites 23, 24 and 25. Interestingly, in all but three pairs of sites (9-10,
14-15 and 15-16), either richness difference or replacement accounts for the whole
dissimilarity value.
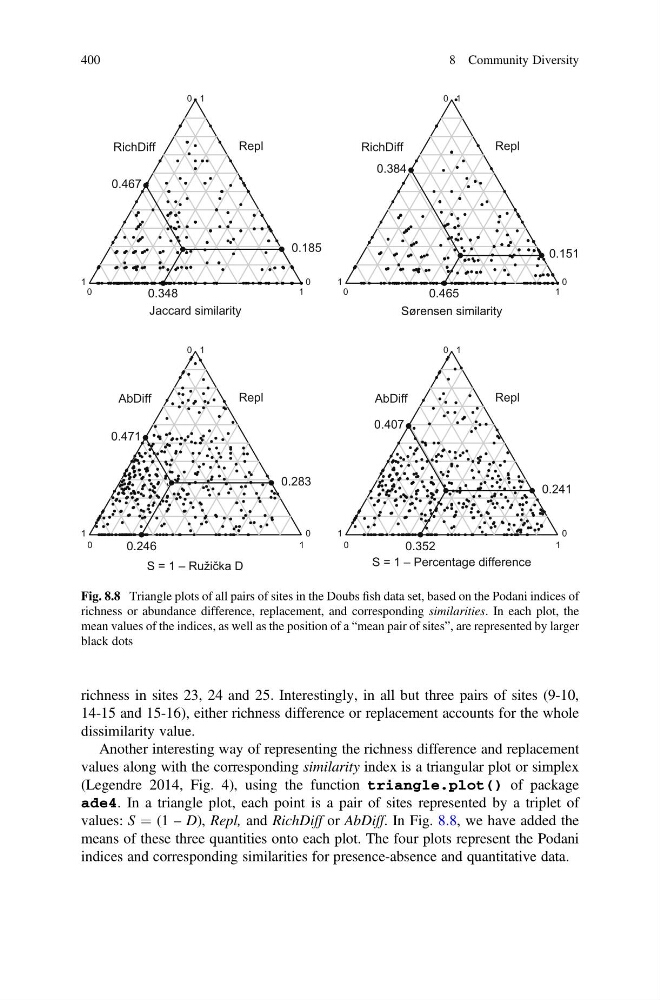
Another interesting way of representing the richness difference and replacement
values along with the corresponding similarity index is a triangular plot or simplex
(Legendre 2014, Fig. 4), using the function triangle.plot() of package
ade4. In a triangle plot, each point is a pair of sites represented by a triplet of
values: S ¼ (1 – D), Repl, and RichDiff or AbDiff. In Fig. 8.8, we have added the
means of these three quantities onto each plot. The four plots represent the Podani
indices and corresponding similarities for presence-absence and quantitative data.
0 1
1
0
1
0
0.467
0.348
0.185
RichDiff
Repl
Jaccard similarity
S = 1 – Percentage difference
S = 1 – Ruzicka D
0 1
1
0
1
0
0.384
0.465
0.151
RichDiff
Repl
0 1
1
0
1
0
0.471
0.246
0.283
AbDiff
Repl
0 1
1
0
1
0
0.407
0.352
0.241
AbDiff
Repl
Fig. 8.8 Triangle plots of all pairs of sites in the Doubs fish data set, based on the Podani indices of
richness or abundance difference, replacement, and corresponding similarities. In each plot, the
mean values of the indices, as well as the position of a “mean pair of sites”, are represented by larger
black dots
400
8 Community Diversity
14-15 and 15-16), either richness difference or replacement accounts for the whole
dissimilarity value.
Another interesting way of representing the richness difference and replacement
values along with the corresponding similarity index is a triangular plot or simplex
(Legendre 2014, Fig. 4), using the function triangle.plot() of package
ade4. In a triangle plot, each point is a pair of sites represented by a triplet of
values: S ¼ (1 – D), Repl, and RichDiff or AbDiff. In Fig. 8.8, we have added the
means of these three quantities onto each plot. The four plots represent the Podani
indices and corresponding similarities for presence-absence and quantitative data.
0 1
1
0
1
0
0.467
0.348
0.185
RichDiff
Repl
Jaccard similarity
S = 1 – Percentage difference
S = 1 – Ruzicka D
0 1
1
0
1
0
0.384
0.465
0.151
RichDiff
Repl
0 1
1
0
1
0
0.471
0.246
0.283
AbDiff
Repl
0 1
1
0
1
0
0.407
0.352
0.241
AbDiff
Repl
Fig. 8.8 Triangle plots of all pairs of sites in the Doubs fish data set, based on the Podani indices of
richness or abundance difference, replacement, and corresponding similarities. In each plot, the
mean values of the indices, as well as the position of a “mean pair of sites”, are represented by larger
black dots
400
8 Community Diversity