

# Extraction of the replacement matrix
fish.repl <- as.matrix(fish.pod.j$repl)
# Extraction of the Jaccard dissimilarity D J matrix
fish.jac <- as.matrix(fish.pod.j$D)
# Plot of the Jaccard, replacement and richness difference indices
# between nearest neighbours
# First, extract the subdiagonals of the square dissimilarity
# matrices
fish.repl.neigh <- diag(fish.repl[-1, ]) # Replacement
fish.rich.neigh <- diag(fish.rich[-1, ]) # Richness difference
fish.jac.neigh <- diag(fish.jac[-1, ]) # Jaccard D J index
label.pairs = c("1-2", "2-3", "3-4", "4-5", "5-6", "6-7", " ",
"7-9", "9-10", "10-11", "11-12", "12-13", "13-14", "14-15",
"15-16", "16-17", "17-18", "18-19", "19-20", "20-21", "21-22",
"22-23", "23-24", "24-25", "25-26", "26-27", "27-28", "28-29",
"29-30")
plot(
absc,
fish.jac.neigh,
type = "n",
xaxt = "n",
main = "Replacement - Richness difference - Jaccard -
nearest neighbours",
xlab = "Site pairs",
ylab = "Podani's indices"
)
axis(side = 1, 2:30, labels = label.pairs, las = 2, cex.axis = 0.9)
lines(absc, fish.jac.neigh, col = "black")
0.0 0.2 0.4 0.6 0.8
Replacement - Richness difference - Jaccard - nearest neighbours
Site pairs
Podani's indices
1-2
2-3
3-4
4-5
5-6
6-7
7-9
9-10
10-11
11-12
12-13
13-14
14-15
15-16
16-17
17-18
18-19
19-20
20-21
21-22
22-23
23-24
24-25
25-26
26-27
27-28
28-29
29-30
Jaccard D
Replacement
Richness difference
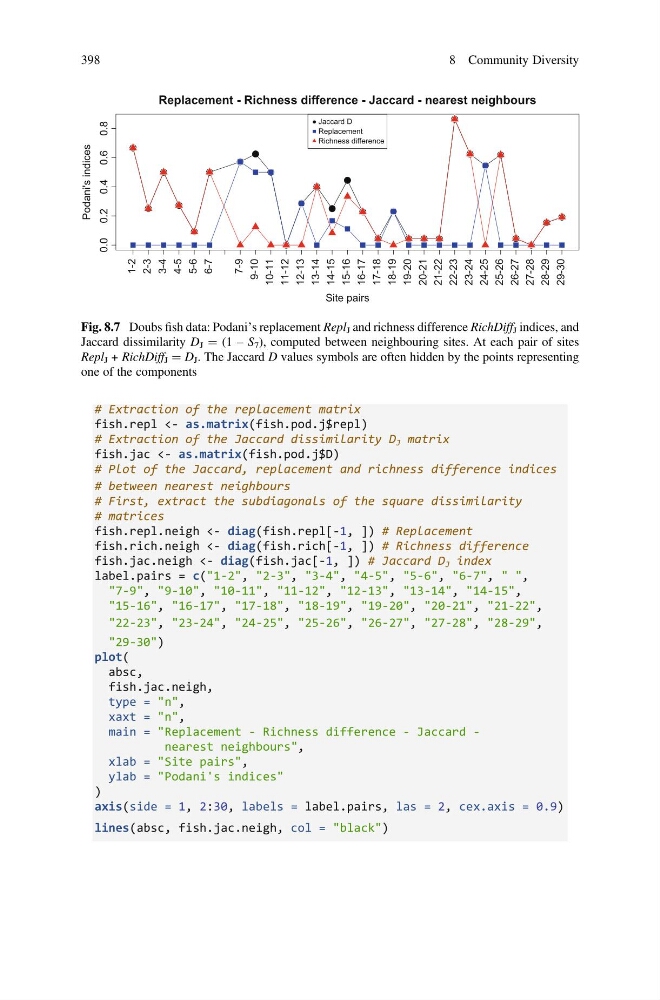
Fig. 8.7 Doubs fish data: Podani’s replacement Repl J and richness difference RichDiff J indices, and
Jaccard dissimilarity D J ¼ (1 – S 7 ), computed between neighbouring sites. At each pair of sites
Repl J + RichDiff J ¼ D J . The Jaccard D values symbols are often hidden by the points representing
one of the components
398
8 Community Diversity
fish.repl <- as.matrix(fish.pod.j$repl)
# Extraction of the Jaccard dissimilarity D J matrix
fish.jac <- as.matrix(fish.pod.j$D)
# Plot of the Jaccard, replacement and richness difference indices
# between nearest neighbours
# First, extract the subdiagonals of the square dissimilarity
# matrices
fish.repl.neigh <- diag(fish.repl[-1, ]) # Replacement
fish.rich.neigh <- diag(fish.rich[-1, ]) # Richness difference
fish.jac.neigh <- diag(fish.jac[-1, ]) # Jaccard D J index
label.pairs = c("1-2", "2-3", "3-4", "4-5", "5-6", "6-7", " ",
"7-9", "9-10", "10-11", "11-12", "12-13", "13-14", "14-15",
"15-16", "16-17", "17-18", "18-19", "19-20", "20-21", "21-22",
"22-23", "23-24", "24-25", "25-26", "26-27", "27-28", "28-29",
"29-30")
plot(
absc,
fish.jac.neigh,
type = "n",
xaxt = "n",
main = "Replacement - Richness difference - Jaccard -
nearest neighbours",
xlab = "Site pairs",
ylab = "Podani's indices"
)
axis(side = 1, 2:30, labels = label.pairs, las = 2, cex.axis = 0.9)
lines(absc, fish.jac.neigh, col = "black")
0.0 0.2 0.4 0.6 0.8
Replacement - Richness difference - Jaccard - nearest neighbours
Site pairs
Podani's indices
1-2
2-3
3-4
4-5
5-6
6-7
7-9
9-10
10-11
11-12
12-13
13-14
14-15
15-16
16-17
17-18
18-19
19-20
20-21
21-22
22-23
23-24
24-25
25-26
26-27
27-28
28-29
29-30
Jaccard D
Replacement
Richness difference
Fig. 8.7 Doubs fish data: Podani’s replacement Repl J and richness difference RichDiff J indices, and
Jaccard dissimilarity D J ¼ (1 – S 7 ), computed between neighbouring sites. At each pair of sites
Repl J + RichDiff J ¼ D J . The Jaccard D values symbols are often hidden by the points representing
one of the components
398
8 Community Diversity