

of species and individuals are 21 species and 96 individuals. Therefore, the estimated
species richness for 80 individuals is close.
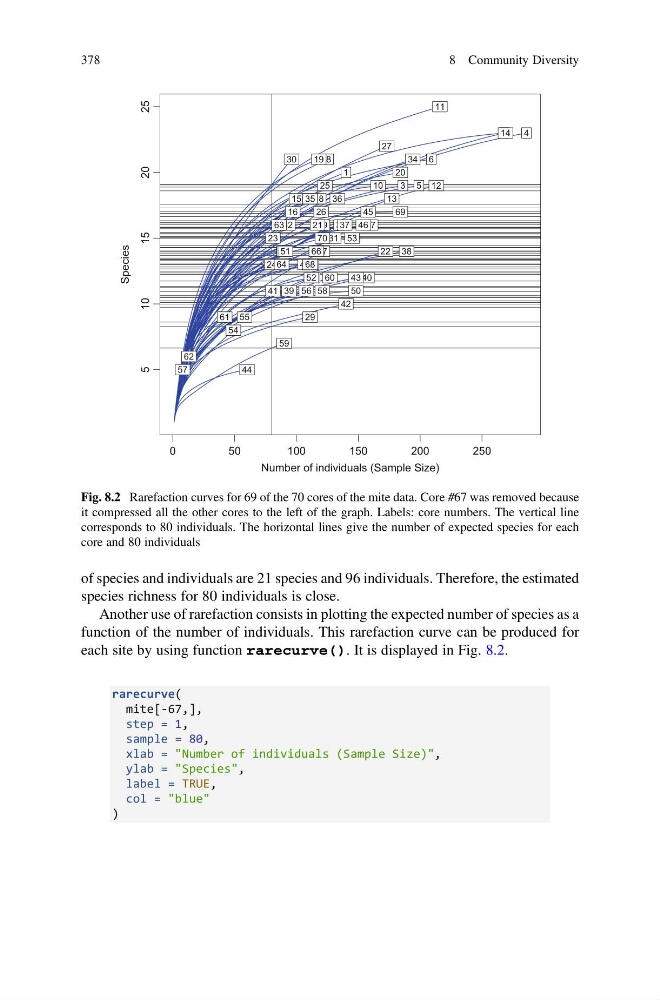
Another use of rarefaction consists in plotting the expected number of species as a
function of the number of individuals. This rarefaction curve can be produced for
each site by using function rarecurve(). It is displayed in Fig. 8.2.
rarecurve(
mite[-67,],
step = 1,
sample = 80,
xlab = "Number of individuals (Sample Size)",
ylab = "Species",
label = TRUE,
col = "blue"
)
0
50
100
150
200
250
5
10
15
20
25
Number of individuals (Sample Size)
Species
1
2
3
4
5
6
7
8
9
10
11
12
13
14
15
16
17
18
19
20
21
22
23
24
25
26
27
28
29
30
31
32
33
34
35
36
37
38
39
40
41
42
43
44
45
46
47
48
49
50
51
52
53
54
55
56
57
58
59
60
61
62
63
64
65
66
68
69
70
Fig. 8.2 Rarefaction curves for 69 of the 70 cores of the mite data. Core #67 was removed because
it compressed all the other cores to the left of the graph. Labels: core numbers. The vertical line
corresponds to 80 individuals. The horizontal lines give the number of expected species for each
core and 80 individuals
378
8 Community Diversity
species richness for 80 individuals is close.
Another use of rarefaction consists in plotting the expected number of species as a
function of the number of individuals. This rarefaction curve can be produced for
each site by using function rarecurve(). It is displayed in Fig. 8.2.
rarecurve(
mite[-67,],
step = 1,
sample = 80,
xlab = "Number of individuals (Sample Size)",
ylab = "Species",
label = TRUE,
col = "blue"
)
0
50
100
150
200
250
5
10
15
20
25
Number of individuals (Sample Size)
Species
1
2
3
4
5
6
7
8
9
10
11
12
13
14
15
16
17
18
19
20
21
22
23
24
25
26
27
28
29
30
31
32
33
34
35
36
37
38
39
40
41
42
43
44
45
46
47
48
49
50
51
52
53
54
55
56
57
58
59
60
61
62
63
64
65
66
68
69
70
Fig. 8.2 Rarefaction curves for 69 of the 70 cores of the mite data. Core #67 was removed because
it compressed all the other cores to the left of the graph. Labels: core numbers. The vertical line
corresponds to 80 individuals. The horizontal lines give the number of expected species for each
core and 80 individuals
378
8 Community Diversity