

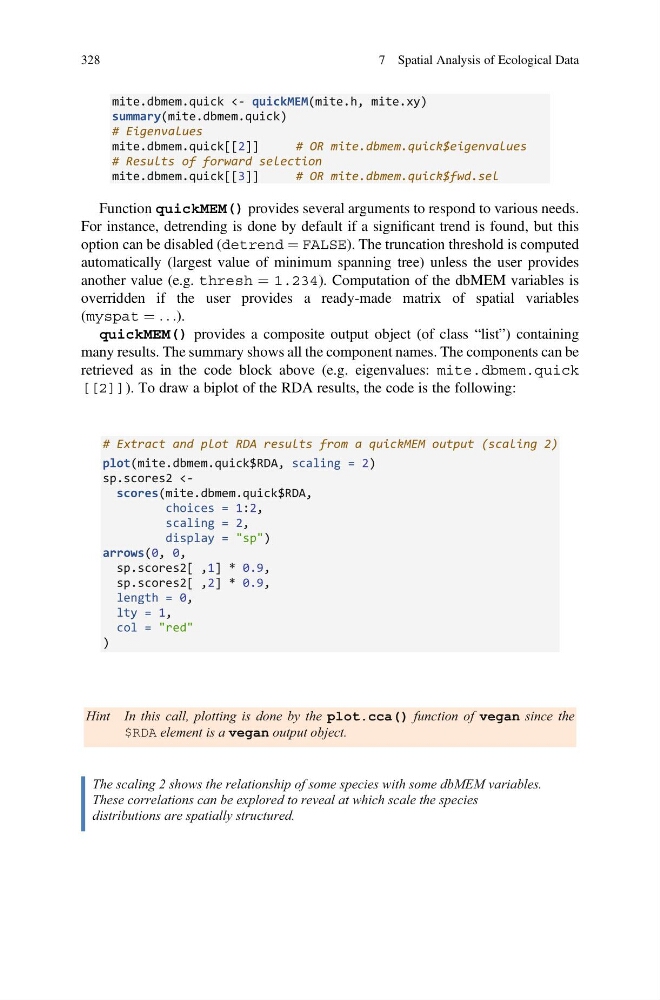
mite.dbmem.quick <- quickMEM(mite.h, mite.xy)
summary(mite.dbmem.quick)
# Eigenvalues
mite.dbmem.quick[[2]]
# OR mite.dbmem.quick$eigenvalues
# Results of forward selection
mite.dbmem.quick[[3]]
# OR mite.dbmem.quick$fwd.sel
Function quickMEM() provides several arguments to respond to various needs.
For instance, detrending is done by default if a significant trend is found, but this
option can be disabled (detrend ¼ FALSE). The truncation threshold is computed
automatically (largest value of minimum spanning tree) unless the user provides
another value (e.g. thresh ¼ 1.234). Computation of the dbMEM variables is
overridden if the user provides a ready-made matrix of spatial variables
(myspat ¼ . . .).
quickMEM() provides a composite output object (of class “list”) containing
many results. The summary shows all the component names. The components can be
retrieved as in the code block above (e.g. eigenvalues: mite.dbmem.quick
[[2]]). To draw a biplot of the RDA results, the code is the following:
# Extract and plot RDA results from a quickMEM output (scaling 2)
plot(mite.dbmem.quick$RDA, scaling = 2)
sp.scores2
scaling = 2,
display = "sp")
arrows(0, 0,
sp.scores2[ ,1] * 0.9,
sp.scores2[ ,2] * 0.9,
length = 0,
lty = 1,
col = "red"
)
Hint In this call, plotting is done by the plot.cca() function of vegan since the
$RDA element is a vegan output object.
The scaling 2 shows the relationship of some species with some dbMEM variables.
These correlations can be explored to reveal at which scale the species
distributions are spatially structured.
328
7 Spatial Analysis of Ecological Data
summary(mite.dbmem.quick)
# Eigenvalues
mite.dbmem.quick[[2]]
# OR mite.dbmem.quick$eigenvalues
# Results of forward selection
mite.dbmem.quick[[3]]
# OR mite.dbmem.quick$fwd.sel
Function quickMEM() provides several arguments to respond to various needs.
For instance, detrending is done by default if a significant trend is found, but this
option can be disabled (detrend ¼ FALSE). The truncation threshold is computed
automatically (largest value of minimum spanning tree) unless the user provides
another value (e.g. thresh ¼ 1.234). Computation of the dbMEM variables is
overridden if the user provides a ready-made matrix of spatial variables
(myspat ¼ . . .).
quickMEM() provides a composite output object (of class “list”) containing
many results. The summary shows all the component names. The components can be
retrieved as in the code block above (e.g. eigenvalues: mite.dbmem.quick
[[2]]). To draw a biplot of the RDA results, the code is the following:
# Extract and plot RDA results from a quickMEM output (scaling 2)
plot(mite.dbmem.quick$RDA, scaling = 2)
sp.scores2
scaling = 2,
display = "sp")
arrows(0, 0,
sp.scores2[ ,1] * 0.9,
sp.scores2[ ,2] * 0.9,
length = 0,
lty = 1,
col = "red"
)
Hint In this call, plotting is done by the plot.cca() function of vegan since the
$RDA element is a vegan output object.
The scaling 2 shows the relationship of some species with some dbMEM variables.
These correlations can be explored to reveal at which scale the species
distributions are spatially structured.
328
7 Spatial Analysis of Ecological Data