

The same data will now be submitted to a fourth-corner analysis, which provides
tests at the bivariate level, i.e. one trait and one environmental variable at a time. This
is where the correction for multiple tests is necessary. Given the large number of
permutations needed to reach an adequately precise estimation of the p-value, the
most astute way of computing this analysis consists in a first computation without
any correction for multiple testing. The resulting object can be corrected afterwards.
So, if several types of corrections must be examined, there is no need to recompute
the whole analysis and its large and time-consuming number of permutations.
The fourth-corner analysis is computed by means of the function
fourthcorner() of ade4, using model 6 advocated by Dray et al. (2014).
The correction for multiple testing is taken care of by the function p.
adjust.4thcorner(), which operates on the output object of the analysis.
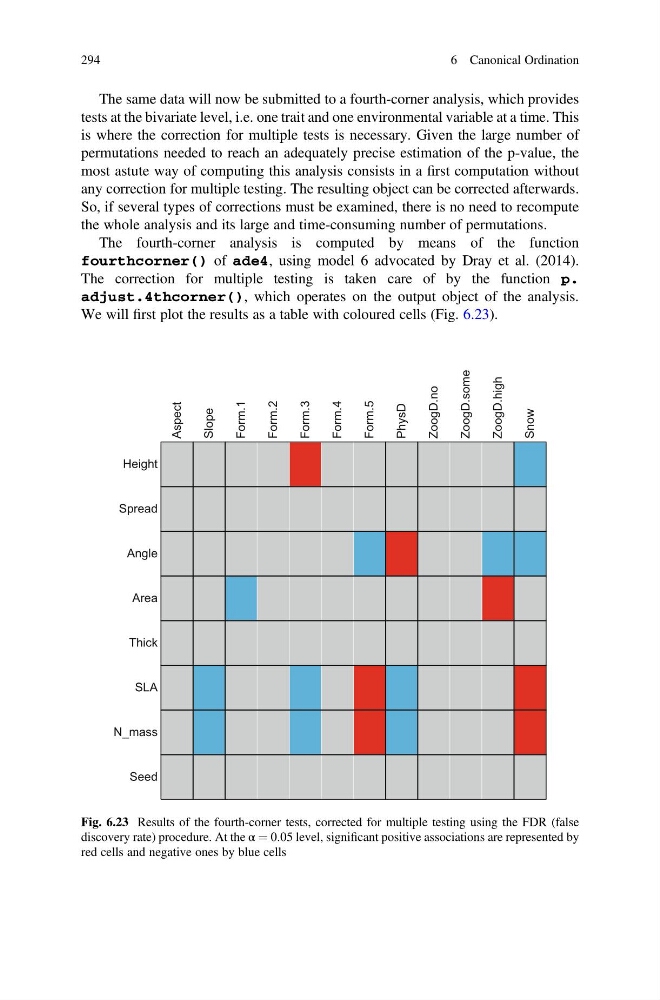
We will first plot the results as a table with coloured cells (Fig. 6.23).
Height
Spread
Angle
Area
Thick
SLA
N_mass
Seed
Aspect
Slope
Form.1
Form.2
Form.3
Form.4
Form.5
PhysD
ZoogD.no
ZoogD.some
ZoogD.high
Snow
Fig. 6.23 Results of the fourth-corner tests, corrected for multiple testing using the FDR (false
discovery rate) procedure. At the α ¼ 0.05 level, significant positive associations are represented by
red cells and negative ones by blue cells
294
6 Canonical Ordination
tests at the bivariate level, i.e. one trait and one environmental variable at a time. This
is where the correction for multiple tests is necessary. Given the large number of
permutations needed to reach an adequately precise estimation of the p-value, the
most astute way of computing this analysis consists in a first computation without
any correction for multiple testing. The resulting object can be corrected afterwards.
So, if several types of corrections must be examined, there is no need to recompute
the whole analysis and its large and time-consuming number of permutations.
The fourth-corner analysis is computed by means of the function
fourthcorner() of ade4, using model 6 advocated by Dray et al. (2014).
The correction for multiple testing is taken care of by the function p.
adjust.4thcorner(), which operates on the output object of the analysis.
We will first plot the results as a table with coloured cells (Fig. 6.23).
Height
Spread
Angle
Area
Thick
SLA
N_mass
Seed
Aspect
Slope
Form.1
Form.2
Form.3
Form.4
Form.5
PhysD
ZoogD.no
ZoogD.some
ZoogD.high
Snow
Fig. 6.23 Results of the fourth-corner tests, corrected for multiple testing using the FDR (false
discovery rate) procedure. At the α ¼ 0.05 level, significant positive associations are represented by
red cells and negative ones by blue cells
294
6 Canonical Ordination