

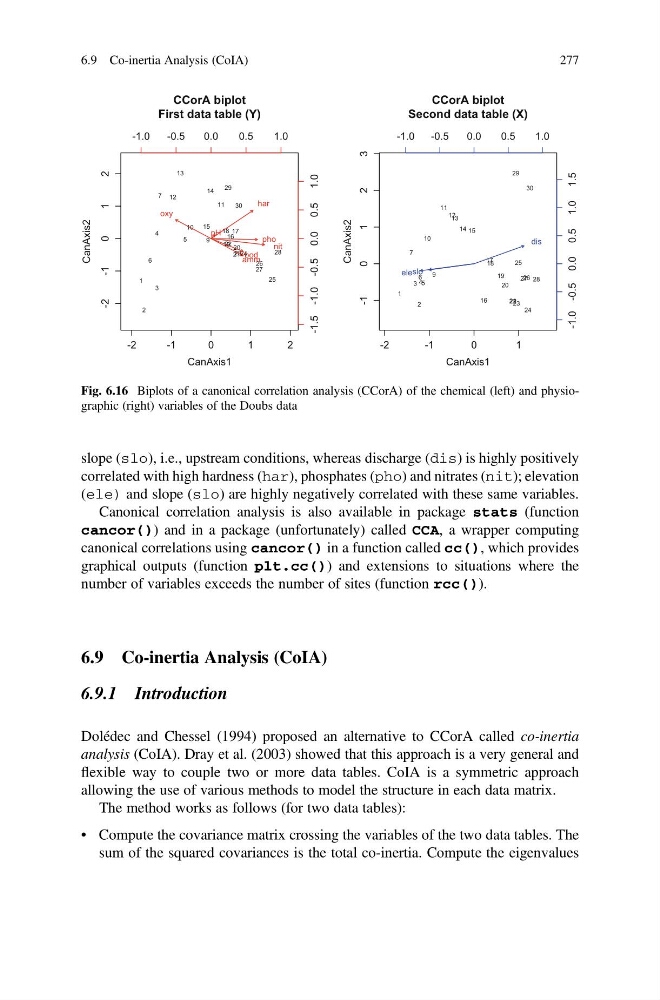
slope (slo), i.e., upstream conditions, whereas discharge (dis) is highly positively
correlated with high hardness (har), phosphates (pho) and nitrates (nit); elevation
(ele) and slope (slo) are highly negatively correlated with these same variables.
Canonical correlation analysis is also available in package stats (function
cancor()) and in a package (unfortunately) called CCA, a wrapper computing
canonical correlations using cancor() in a function called cc(), which provides
graphical outputs (function plt.cc()) and extensions to situations where the
number of variables exceeds the number of sites (function rcc()).
6.9 Co-inertia Analysis (CoIA)
6.9.1 Introduction
Dolédec and Chessel (1994) proposed an alternative to CCorA called co-inertia
analysis (CoIA). Dray et al. (2003) showed that this approach is a very general and
flexible way to couple two or more data tables. CoIA is a symmetric approach
allowing the use of various methods to model the structure in each data matrix.
The method works as follows (for two data tables):
• Compute the covariance matrix crossing the variables of the two data tables. The
sum of the squared covariances is the total co-inertia. Compute the eigenvalues
-2
-1
0
1
2
-2
-1
0
1
2
CanAxis1
CanAxis2
1
2
3
4
5
6
7
9
10
11
12
13
14
15
16
17
18
19 20
21
22
2324
25
26
27
28
29
30
-1.0
-0.5
0.0
0.5
1.0
-1.5 -1.0 -0.5 0.0 0.5 1.0
pH
har
pho
nit
amm
oxy
bod
CCorA biplot
First data table (Y)
-2
-1
0
1
-1
0
1
2
3
CanAxis1
CanAxis2
1
2
3 45
6
7
9
10
11
12 13
14 15
16
17 18
19
20
21 22 23
24
25
26
27 28
29
30
-1.0
-0.5
0.0
0.5
1.0
-1.0
-0.5 0.0
0.5 1.0
1.5
eleslo
dis
CCorA biplot
Second data table (X)
Fig. 6.16 Biplots of a canonical correlation analysis (CCorA) of the chemical (left) and physiographic (right) variables of the Doubs data
6.9 Co-inertia Analysis (CoIA)
277
correlated with high hardness (har), phosphates (pho) and nitrates (nit); elevation
(ele) and slope (slo) are highly negatively correlated with these same variables.
Canonical correlation analysis is also available in package stats (function
cancor()) and in a package (unfortunately) called CCA, a wrapper computing
canonical correlations using cancor() in a function called cc(), which provides
graphical outputs (function plt.cc()) and extensions to situations where the
number of variables exceeds the number of sites (function rcc()).
6.9 Co-inertia Analysis (CoIA)
6.9.1 Introduction
Dolédec and Chessel (1994) proposed an alternative to CCorA called co-inertia
analysis (CoIA). Dray et al. (2003) showed that this approach is a very general and
flexible way to couple two or more data tables. CoIA is a symmetric approach
allowing the use of various methods to model the structure in each data matrix.
The method works as follows (for two data tables):
• Compute the covariance matrix crossing the variables of the two data tables. The
sum of the squared covariances is the total co-inertia. Compute the eigenvalues
-2
-1
0
1
2
-2
-1
0
1
2
CanAxis1
CanAxis2
1
2
3
4
5
6
7
9
10
11
12
13
14
15
16
17
18
19 20
21
22
2324
25
26
27
28
29
30
-1.0
-0.5
0.0
0.5
1.0
-1.5 -1.0 -0.5 0.0 0.5 1.0
pH
har
pho
nit
amm
oxy
bod
CCorA biplot
First data table (Y)
-2
-1
0
1
-1
0
1
2
3
CanAxis1
CanAxis2
1
2
3 45
6
7
9
10
11
12 13
14 15
16
17 18
19
20
21 22 23
24
25
26
27 28
29
30
-1.0
-0.5
0.0
0.5
1.0
-1.0
-0.5 0.0
0.5 1.0
1.5
eleslo
dis
CCorA biplot
Second data table (X)
Fig. 6.16 Biplots of a canonical correlation analysis (CCorA) of the chemical (left) and physiographic (right) variables of the Doubs data
6.9 Co-inertia Analysis (CoIA)
277