

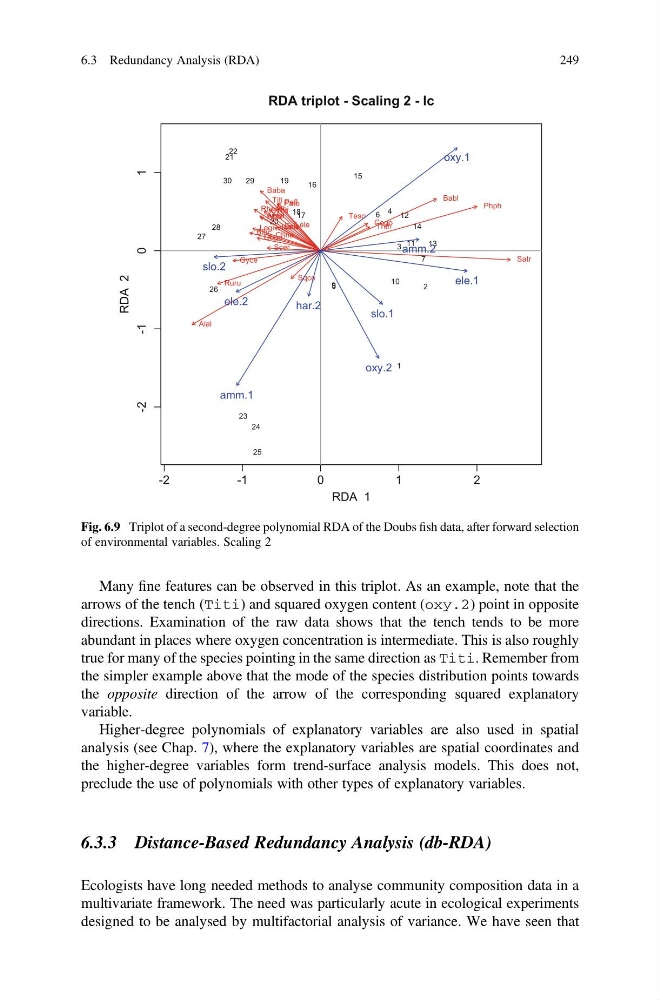
Many fine features can be observed in this triplot. As an example, note that the
arrows of the tench (Titi) and squared oxygen content (oxy.2) point in opposite
directions. Examination of the raw data shows that the tench tends to be more
abundant in places where oxygen concentration is intermediate. This is also roughly
true for many of the species pointing in the same direction as Titi. Remember from
the simpler example above that the mode of the species distribution points towards
the opposite direction of the arrow of the corresponding squared explanatory
variable.
Higher-degree polynomials of explanatory variables are also used in spatial
analysis (see Chap. 7), where the explanatory variables are spatial coordinates and
the higher-degree variables form trend-surface analysis models. This does not,
preclude the use of polynomials with other types of explanatory variables.
6.3.3 Distance-Based Redundancy Analysis (db-RDA)
Ecologists have long needed methods to analyse community composition data in a
multivariate framework. The need was particularly acute in ecological experiments
designed to be analysed by multifactorial analysis of variance. We have seen that
-2
-1
0
1
2
-2
-1
0
1
RDA triplot - Scaling 2 - lc
RDA 1
RDA 2
1
2
3
4
5
6
7
9
10
11
12
13
14
15
16
17
18
19
20
21
22
23
24
25
26
27
28
29
30
Cogo
Satr
Phph
Babl
Thth
Teso
Chna
Pato
Lele
Sqce
Baba
Albi
Gogo
Eslu
Pefl
Rham
Legi
Scer
Cyca
Titi
Abbr
Icme
Gyce
Ruru
Blbj
Alal
Anan
ele.1
ele.2
slo.1
slo.2
har.2
amm.1
amm.2
oxy.1
oxy.2
Fig. 6.9 Triplot of a second-degree polynomial RDA of the Doubs fish data, after forward selection
of environmental variables. Scaling 2
6.3 Redundancy Analysis (RDA)
249
arrows of the tench (Titi) and squared oxygen content (oxy.2) point in opposite
directions. Examination of the raw data shows that the tench tends to be more
abundant in places where oxygen concentration is intermediate. This is also roughly
true for many of the species pointing in the same direction as Titi. Remember from
the simpler example above that the mode of the species distribution points towards
the opposite direction of the arrow of the corresponding squared explanatory
variable.
Higher-degree polynomials of explanatory variables are also used in spatial
analysis (see Chap. 7), where the explanatory variables are spatial coordinates and
the higher-degree variables form trend-surface analysis models. This does not,
preclude the use of polynomials with other types of explanatory variables.
6.3.3 Distance-Based Redundancy Analysis (db-RDA)
Ecologists have long needed methods to analyse community composition data in a
multivariate framework. The need was particularly acute in ecological experiments
designed to be analysed by multifactorial analysis of variance. We have seen that
-2
-1
0
1
2
-2
-1
0
1
RDA triplot - Scaling 2 - lc
RDA 1
RDA 2
1
2
3
4
5
6
7
9
10
11
12
13
14
15
16
17
18
19
20
21
22
23
24
25
26
27
28
29
30
Cogo
Satr
Phph
Babl
Thth
Teso
Chna
Pato
Lele
Sqce
Baba
Albi
Gogo
Eslu
Pefl
Rham
Legi
Scer
Cyca
Titi
Abbr
Icme
Gyce
Ruru
Blbj
Alal
Anan
ele.1
ele.2
slo.1
slo.2
har.2
amm.1
amm.2
oxy.1
oxy.2
Fig. 6.9 Triplot of a second-degree polynomial RDA of the Doubs fish data, after forward selection
of environmental variables. Scaling 2
6.3 Redundancy Analysis (RDA)
249