

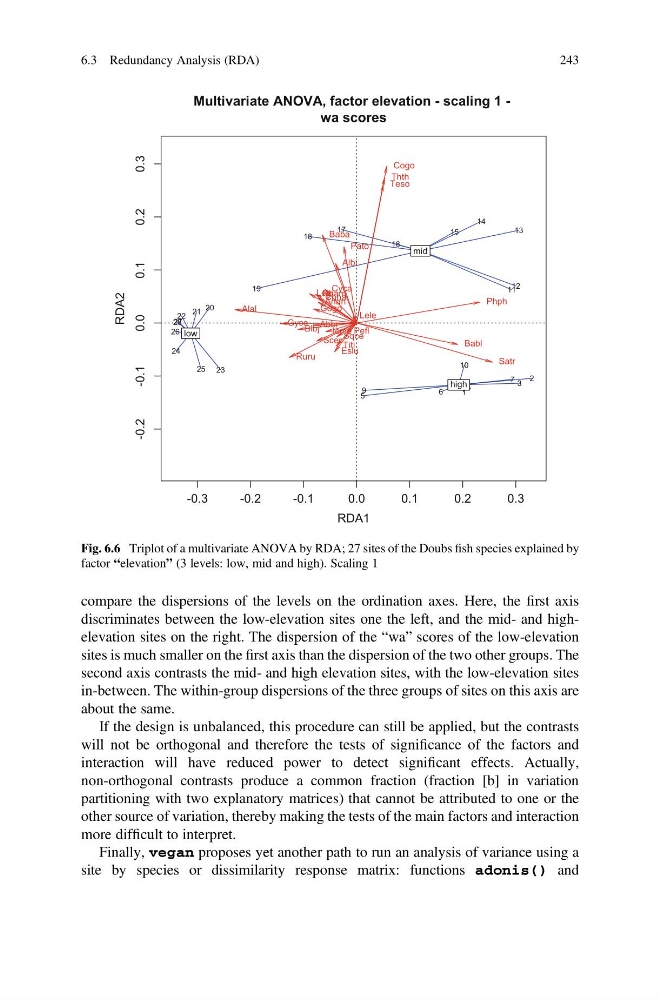
compare the dispersions of the levels on the ordination axes. Here, the first axis
discriminates between the low-elevation sites one the left, and the mid- and highelevation sites on the right. The dispersion of the “wa” scores of the low-elevation
sites is much smaller on the first axis than the dispersion of the two other groups. The
second axis contrasts the mid- and high elevation sites, with the low-elevation sites
in-between. The within-group dispersions of the three groups of sites on this axis are
about the same.
If the design is unbalanced, this procedure can still be applied, but the contrasts
will not be orthogonal and therefore the tests of significance of the factors and
interaction will have reduced power to detect significant effects. Actually,
non-orthogonal contrasts produce a common fraction (fraction [b] in variation
partitioning with two explanatory matrices) that cannot be attributed to one or the
other source of variation, thereby making the tests of the main factors and interaction
more difficult to interpret.
Finally, vegan proposes yet another path to run an analysis of variance using a
site by species or dissimilarity response matrix: functions adonis() and
-0.3
-0.2
-0.1
0.0
0.1
0.2
0.3
-0.2
-0.1
0.0
0.1
0.2
0.3
Multivariate ANOVA, factor elevation - scaling 1 -
wa scores
RDA1
RDA2
1
2
3
4
5
6
7
9
10
11 12
13
14
15
16
17
18
19
20
21
22
23
24
25
26
27
28
high
mid
low
Cogo
Satr
Phph
Babl
Thth
Teso
Chna
Pato
Lele
Sqce
Baba
Albi
Gogo
Eslu
Pefl
Rham
Legi
Scer
Cyca
Titi
Abbr
Icme
Gyce
Ruru
Blbj
Alal
Anan
Fig. 6.6 Triplot of a multivariate ANOVA by RDA; 27 sites of the Doubs fish species explained by
factor “elevation” (3 levels: low, mid and high). Scaling 1
6.3 Redundancy Analysis (RDA)
243
discriminates between the low-elevation sites one the left, and the mid- and highelevation sites on the right. The dispersion of the “wa” scores of the low-elevation
sites is much smaller on the first axis than the dispersion of the two other groups. The
second axis contrasts the mid- and high elevation sites, with the low-elevation sites
in-between. The within-group dispersions of the three groups of sites on this axis are
about the same.
If the design is unbalanced, this procedure can still be applied, but the contrasts
will not be orthogonal and therefore the tests of significance of the factors and
interaction will have reduced power to detect significant effects. Actually,
non-orthogonal contrasts produce a common fraction (fraction [b] in variation
partitioning with two explanatory matrices) that cannot be attributed to one or the
other source of variation, thereby making the tests of the main factors and interaction
more difficult to interpret.
Finally, vegan proposes yet another path to run an analysis of variance using a
site by species or dissimilarity response matrix: functions adonis() and
-0.3
-0.2
-0.1
0.0
0.1
0.2
0.3
-0.2
-0.1
0.0
0.1
0.2
0.3
Multivariate ANOVA, factor elevation - scaling 1 -
wa scores
RDA1
RDA2
1
2
3
4
5
6
7
9
10
11 12
13
14
15
16
17
18
19
20
21
22
23
24
25
26
27
28
high
mid
low
Cogo
Satr
Phph
Babl
Thth
Teso
Chna
Pato
Lele
Sqce
Baba
Albi
Gogo
Eslu
Pefl
Rham
Legi
Scer
Cyca
Titi
Abbr
Icme
Gyce
Ruru
Blbj
Alal
Anan
Fig. 6.6 Triplot of a multivariate ANOVA by RDA; 27 sites of the Doubs fish species explained by
factor “elevation” (3 levels: low, mid and high). Scaling 1
6.3 Redundancy Analysis (RDA)
243