

Hints Observe the shortcut (.) to tell the function to use all variables present in data
frame env3, without having to enumerate them.
If you don’t want to see the site, species and constraint scores, add argument
axes = 0 to the summary() call.
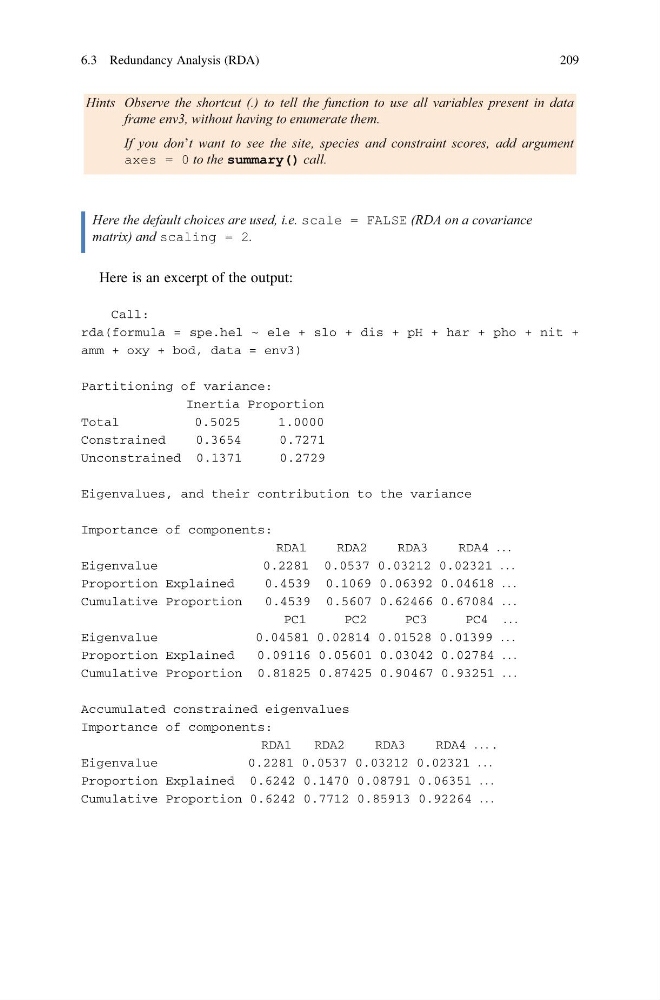
Here the default choices are used, i.e. scale = FALSE (RDA on a covariance
matrix) and scaling = 2.
Here is an excerpt of the output:
Call:
rda(formula = spe.hel ~ ele + slo + dis + pH + har + pho + nit +
amm + oxy + bod, data = env3)
Partitioning of variance:
Inertia Proportion
Total
0.5025
1.0000
Constrained
0.3654
0.7271
Unconstrained 0.1371
0.2729
Eigenvalues, and their contribution to the variance
Importance of components:
RDA1
RDA2
RDA3
RDA4 . . .
Eigenvalue
0.2281 0.0537 0.03212 0.02321 . . .
Proportion Explained
0.4539 0.1069 0.06392 0.04618 . . .
Cumulative Proportion
0.4539 0.5607 0.62466 0.67084 . . .
PC1
PC2
PC3
PC4 . . .
Eigenvalue
0.04581 0.02814 0.01528 0.01399 . . .
Proportion Explained
0.09116 0.05601 0.03042 0.02784 . . .
Cumulative Proportion 0.81825 0.87425 0.90467 0.93251 . . .
Accumulated constrained eigenvalues
Importance of components:
RDA1
RDA2
RDA3
RDA4 . . . .
Eigenvalue
0.2281 0.0537 0.03212 0.02321 . . .
Proportion Explained 0.6242 0.1470 0.08791 0.06351 . . .
Cumulative Proportion 0.6242 0.7712 0.85913 0.92264 . . .
6.3 Redundancy Analysis (RDA)
209
frame env3, without having to enumerate them.
If you don’t want to see the site, species and constraint scores, add argument
axes = 0 to the summary() call.
Here the default choices are used, i.e. scale = FALSE (RDA on a covariance
matrix) and scaling = 2.
Here is an excerpt of the output:
Call:
rda(formula = spe.hel ~ ele + slo + dis + pH + har + pho + nit +
amm + oxy + bod, data = env3)
Partitioning of variance:
Inertia Proportion
Total
0.5025
1.0000
Constrained
0.3654
0.7271
Unconstrained 0.1371
0.2729
Eigenvalues, and their contribution to the variance
Importance of components:
RDA1
RDA2
RDA3
RDA4 . . .
Eigenvalue
0.2281 0.0537 0.03212 0.02321 . . .
Proportion Explained
0.4539 0.1069 0.06392 0.04618 . . .
Cumulative Proportion
0.4539 0.5607 0.62466 0.67084 . . .
PC1
PC2
PC3
PC4 . . .
Eigenvalue
0.04581 0.02814 0.01528 0.01399 . . .
Proportion Explained
0.09116 0.05601 0.03042 0.02784 . . .
Cumulative Proportion 0.81825 0.87425 0.90467 0.93251 . . .
Accumulated constrained eigenvalues
Importance of components:
RDA1
RDA2
RDA3
RDA4 . . . .
Eigenvalue
0.2281 0.0537 0.03212 0.02321 . . .
Proportion Explained 0.6242 0.1470 0.08791 0.06351 . . .
Cumulative Proportion 0.6242 0.7712 0.85913 0.92264 . . .
6.3 Redundancy Analysis (RDA)
209