

Let us build a multivariate regression tree of the Doubs fish data constrained by
the environmental variables. We will use the fish species data with site vectors
normalized to length 1 (chord transformation in Sect. 2.2.4) so that the distance
actually preserved is the chord distance. Among the arguments, we will use
xval ¼ 29 cross-validation groups (i.e., as many groups as rows in the data, instead
of the usual 10, owing to the small number of observations), 100 iterations, and we
will allow ourselves to interactively pick a solution on a graph provided by
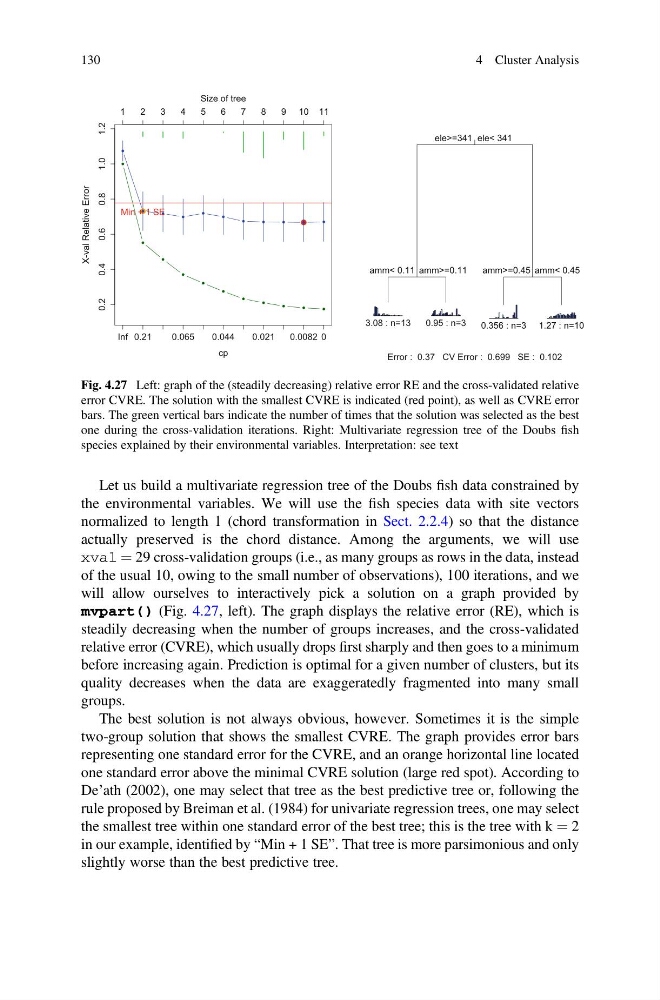
mvpart() (Fig. 4.27, left). The graph displays the relative error (RE), which is
steadily decreasing when the number of groups increases, and the cross-validated
relative error (CVRE), which usually drops first sharply and then goes to a minimum
before increasing again. Prediction is optimal for a given number of clusters, but its
quality decreases when the data are exaggeratedly fragmented into many small
groups.
The best solution is not always obvious, however. Sometimes it is the simple
two-group solution that shows the smallest CVRE. The graph provides error bars
representing one standard error for the CVRE, and an orange horizontal line located
one standard error above the minimal CVRE solution (large red spot). According to
De’ath (2002), one may select that tree as the best predictive tree or, following the
rule proposed by Breiman et al. (1984) for univariate regression trees, one may select
the smallest tree within one standard error of the best tree; this is the tree with k ¼ 2
in our example, identified by “Min + 1 SE”. That tree is more parsimonious and only
slightly worse than the best predictive tree.
cp
X-val Relative Error
0.2
0.4
0.6
0.8
1.0
1.2
Inf 0.21
0.065
0.044
0.021
0.0082 0
1
2
3
4
5
6
7
8
9 10 11
Size of tree
Min + 1 SE
ele>=341
amm< 0.11
amm>=0.45
ele< 341
amm>=0.11
amm< 0.45
3.08 : n=13
0.95 : n=3
0.356 : n=3 1.27 : n=10
Error : 0.37 CV Error : 0.699 SE : 0.102
Fig. 4.27 Left: graph of the (steadily decreasing) relative error RE and the cross-validated relative
error CVRE. The solution with the smallest CVRE is indicated (red point), as well as CVRE error
bars. The green vertical bars indicate the number of times that the solution was selected as the best
one during the cross-validation iterations. Right: Multivariate regression tree of the Doubs fish
species explained by their environmental variables. Interpretation: see text
130
4 Cluster Analysis
the environmental variables. We will use the fish species data with site vectors
normalized to length 1 (chord transformation in Sect. 2.2.4) so that the distance
actually preserved is the chord distance. Among the arguments, we will use
xval ¼ 29 cross-validation groups (i.e., as many groups as rows in the data, instead
of the usual 10, owing to the small number of observations), 100 iterations, and we
will allow ourselves to interactively pick a solution on a graph provided by
mvpart() (Fig. 4.27, left). The graph displays the relative error (RE), which is
steadily decreasing when the number of groups increases, and the cross-validated
relative error (CVRE), which usually drops first sharply and then goes to a minimum
before increasing again. Prediction is optimal for a given number of clusters, but its
quality decreases when the data are exaggeratedly fragmented into many small
groups.
The best solution is not always obvious, however. Sometimes it is the simple
two-group solution that shows the smallest CVRE. The graph provides error bars
representing one standard error for the CVRE, and an orange horizontal line located
one standard error above the minimal CVRE solution (large red spot). According to
De’ath (2002), one may select that tree as the best predictive tree or, following the
rule proposed by Breiman et al. (1984) for univariate regression trees, one may select
the smallest tree within one standard error of the best tree; this is the tree with k ¼ 2
in our example, identified by “Min + 1 SE”. That tree is more parsimonious and only
slightly worse than the best predictive tree.
cp
X-val Relative Error
0.2
0.4
0.6
0.8
1.0
1.2
Inf 0.21
0.065
0.044
0.021
0.0082 0
1
2
3
4
5
6
7
8
9 10 11
Size of tree
Min + 1 SE
ele>=341
amm< 0.11
amm>=0.45
ele< 341
amm>=0.11
amm< 0.45
3.08 : n=13
0.95 : n=3
0.356 : n=3 1.27 : n=10
Error : 0.37 CV Error : 0.699 SE : 0.102
Fig. 4.27 Left: graph of the (steadily decreasing) relative error RE and the cross-validated relative
error CVRE. The solution with the smallest CVRE is indicated (red point), as well as CVRE error
bars. The green vertical bars indicate the number of times that the solution was selected as the best
one during the cross-validation iterations. Right: Multivariate regression tree of the Doubs fish
species explained by their environmental variables. Interpretation: see text
130
4 Cluster Analysis