

indvalcomp ¼ TRUE, the A (specificity) and B (fidelity) components of the
IndVal index are displayed as well.
The results of this second analysis are slightly different from the previous ones
because for some species the highest IndVal is found for a combination of groups
instead of a single group. For instance, for the brown trout (Satr) the highest value
is found for the combination of groups 1 + 2 whereas, if the analysis is conducted on
separate groups only, the highest IndVal is in group 1.
Our next analysis consists in computing confidence intervals around IndVal
values using function strassoc(). The number of iterations is provided by
argument nboot.
# Indval with bootstrap confidence intervals of indicator values
(iva2.boot <- strassoc(spe, grps, func = "IndVal.g", nboot = 1000))
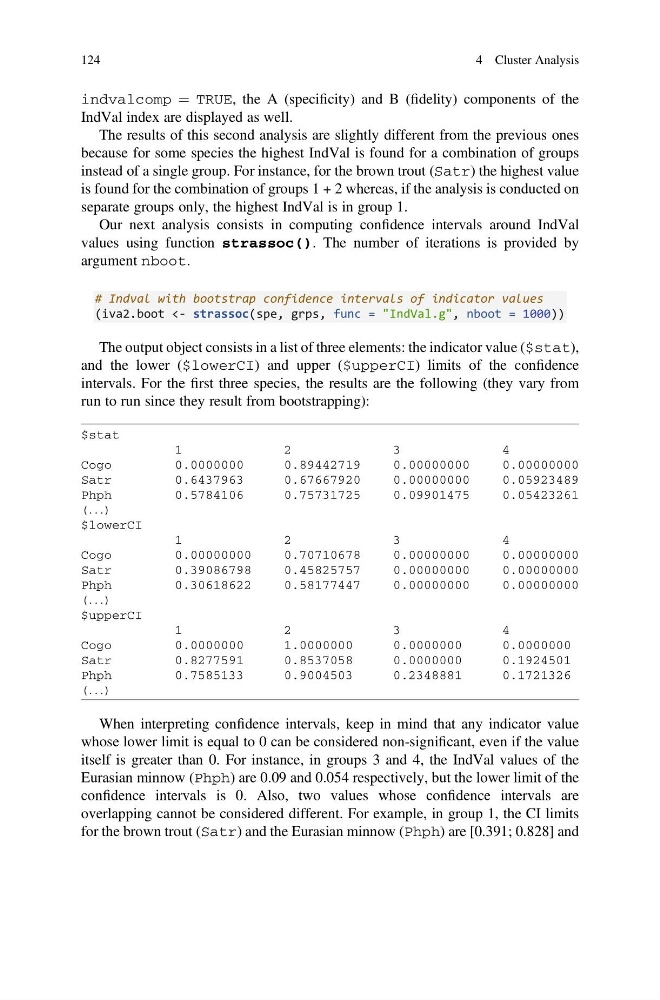
The output object consists in a list of three elements: the indicator value ($stat),
and the lower ($lowerCI) and upper ($upperCI) limits of the confidence
intervals. For the first three species, the results are the following (they vary from
run to run since they result from bootstrapping):
$stat
1
2
3
4
Cogo
0.0000000
0.89442719
0.00000000
0.00000000
Satr
0.6437963
0.67667920
0.00000000
0.05923489
Phph
0.5784106
0.75731725
0.09901475
0.05423261
(. . .)
$lowerCI
1
2
3
4
Cogo
0.00000000
0.70710678
0.00000000
0.00000000
Satr
0.39086798
0.45825757
0.00000000
0.00000000
Phph
0.30618622
0.58177447
0.00000000
0.00000000
(. . .)
$upperCI
1
2
3
4
Cogo
0.0000000
1.0000000
0.0000000
0.0000000
Satr
0.8277591
0.8537058
0.0000000
0.1924501
Phph
0.7585133
0.9004503
0.2348881
0.1721326
(. . .)
When interpreting confidence intervals, keep in mind that any indicator value
whose lower limit is equal to 0 can be considered non-significant, even if the value
itself is greater than 0. For instance, in groups 3 and 4, the IndVal values of the
Eurasian minnow (Phph) are 0.09 and 0.054 respectively, but the lower limit of the
confidence intervals is 0. Also, two values whose confidence intervals are
overlapping cannot be considered different. For example, in group 1, the CI limits
for the brown trout (Satr) and the Eurasian minnow (Phph) are [0.391; 0.828] and
124
4 Cluster Analysis
IndVal index are displayed as well.
The results of this second analysis are slightly different from the previous ones
because for some species the highest IndVal is found for a combination of groups
instead of a single group. For instance, for the brown trout (Satr) the highest value
is found for the combination of groups 1 + 2 whereas, if the analysis is conducted on
separate groups only, the highest IndVal is in group 1.
Our next analysis consists in computing confidence intervals around IndVal
values using function strassoc(). The number of iterations is provided by
argument nboot.
# Indval with bootstrap confidence intervals of indicator values
(iva2.boot <- strassoc(spe, grps, func = "IndVal.g", nboot = 1000))
The output object consists in a list of three elements: the indicator value ($stat),
and the lower ($lowerCI) and upper ($upperCI) limits of the confidence
intervals. For the first three species, the results are the following (they vary from
run to run since they result from bootstrapping):
$stat
1
2
3
4
Cogo
0.0000000
0.89442719
0.00000000
0.00000000
Satr
0.6437963
0.67667920
0.00000000
0.05923489
Phph
0.5784106
0.75731725
0.09901475
0.05423261
(. . .)
$lowerCI
1
2
3
4
Cogo
0.00000000
0.70710678
0.00000000
0.00000000
Satr
0.39086798
0.45825757
0.00000000
0.00000000
Phph
0.30618622
0.58177447
0.00000000
0.00000000
(. . .)
$upperCI
1
2
3
4
Cogo
0.0000000
1.0000000
0.0000000
0.0000000
Satr
0.8277591
0.8537058
0.0000000
0.1924501
Phph
0.7585133
0.9004503
0.2348881
0.1721326
(. . .)
When interpreting confidence intervals, keep in mind that any indicator value
whose lower limit is equal to 0 can be considered non-significant, even if the value
itself is greater than 0. For instance, in groups 3 and 4, the IndVal values of the
Eurasian minnow (Phph) are 0.09 and 0.054 respectively, but the lower limit of the
confidence intervals is 0. Also, two values whose confidence intervals are
overlapping cannot be considered different. For example, in group 1, the CI limits
for the brown trout (Satr) and the Eurasian minnow (Phph) are [0.391; 0.828] and
124
4 Cluster Analysis