

species can be used to compute the adjacency matrix, including Spearman correlations, Jaccard similarity coefficients or the p-values obtained in the previous section.
These metrics can be computed from a species presence-absence or abundance
matrix. A threshold is often applied to restrict the non-zero links to the most
important positive associations to build undirected networks. The network is
drawn in such a way that frequently co-occurring species are located close to one
another in the graph, using various algorithms.
Several R packages are devoted to network analysis. Restricting ourselves to a
basic introduction to this approach, we shall use igraph for network processing
and picante for computing co-occurrence distances (Hardy 2008).
Let us begin by computing several adjacency matrices from the fish species
dataset used above. You can choose one of these symmetric matrices to build the
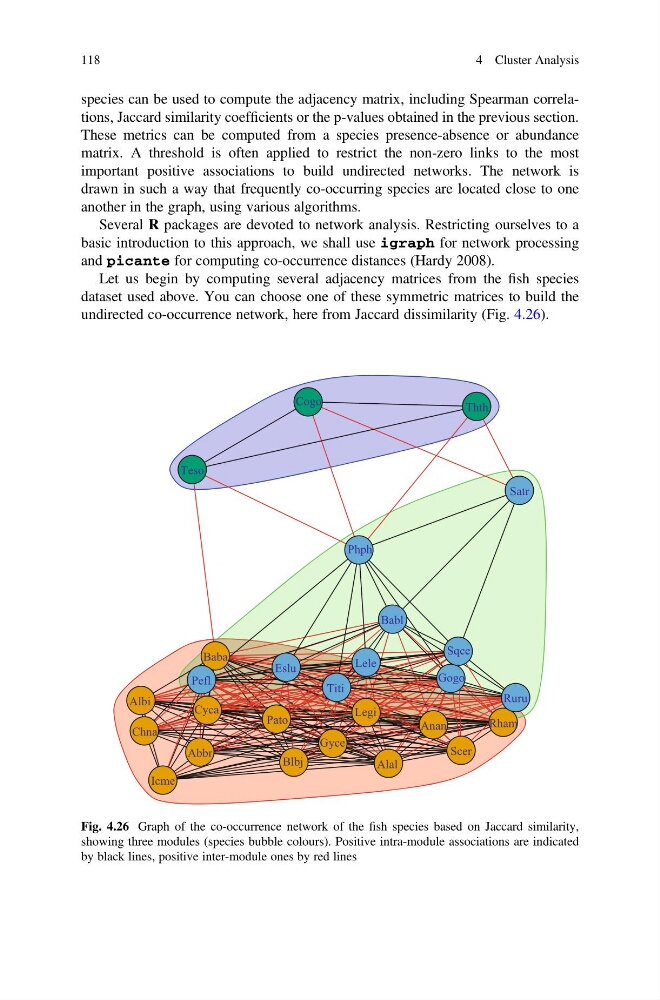
undirected co-occurrence network, here from Jaccard dissimilarity (Fig. 4.26).
Abbr
Alal
Albi
Anan
Baba
Babl
Blbj
Chna
Cogo
Cyca
Eslu
Gogo
Gyce
Icme
Legi
Lele
Pato
Pefl
Phph
Rham
Ruru
Satr
Scer
Sqce
Teso
Thth
Titi
Fig. 4.26 Graph of the co-occurrence network of the fish species based on Jaccard similarity,
showing three modules (species bubble colours). Positive intra-module associations are indicated
by black lines, positive inter-module ones by red lines
118
4 Cluster Analysis
These metrics can be computed from a species presence-absence or abundance
matrix. A threshold is often applied to restrict the non-zero links to the most
important positive associations to build undirected networks. The network is
drawn in such a way that frequently co-occurring species are located close to one
another in the graph, using various algorithms.
Several R packages are devoted to network analysis. Restricting ourselves to a
basic introduction to this approach, we shall use igraph for network processing
and picante for computing co-occurrence distances (Hardy 2008).
Let us begin by computing several adjacency matrices from the fish species
dataset used above. You can choose one of these symmetric matrices to build the
undirected co-occurrence network, here from Jaccard dissimilarity (Fig. 4.26).
Abbr
Alal
Albi
Anan
Baba
Babl
Blbj
Chna
Cogo
Cyca
Eslu
Gogo
Gyce
Icme
Legi
Lele
Pato
Pefl
Phph
Rham
Ruru
Satr
Scer
Sqce
Teso
Thth
Titi
Fig. 4.26 Graph of the co-occurrence network of the fish species based on Jaccard similarity,
showing three modules (species bubble colours). Positive intra-module associations are indicated
by black lines, positive inter-module ones by red lines
118
4 Cluster Analysis