

Hint In the plot, sortg = TRUE reorders the objects in such a way as to put
together, insofar as possible, the objects pertaining to each group. A more
detailed explanation of this argument in provided in the function’s documentation
file.
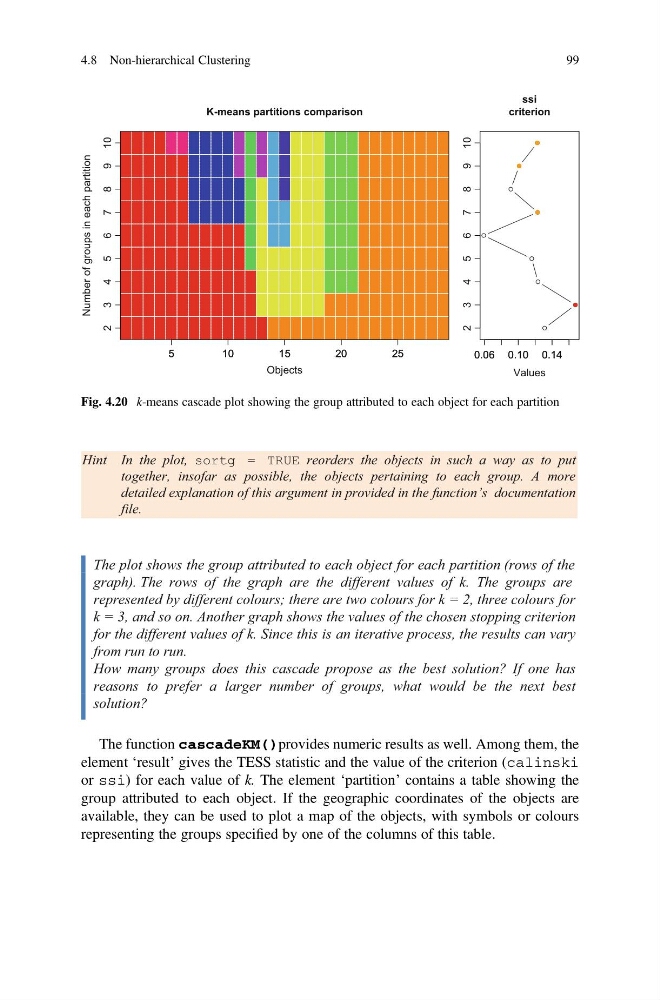
The plot shows the group attributed to each object for each partition (rows of the
graph). The rows of the graph are the different values of k. The groups are
represented by different colours; there are two colours for k = 2, three colours for
k = 3, and so on. Another graph shows the values of the chosen stopping criterion
for the different values of k. Since this is an iterative process, the results can vary
from run to run.
How many groups does this cascade propose as the best solution? If one has
reasons to prefer a larger number of groups, what would be the next best
solution?
The function cascadeKM()provides numeric results as well. Among them, the
element ‘result’ gives the TESS statistic and the value of the criterion (calinski
or ssi) for each value of k. The element ‘partition’ contains a table showing the
group attributed to each object. If the geographic coordinates of the objects are
available, they can be used to plot a map of the objects, with symbols or colours
representing the groups specified by one of the columns of this table.
5
1 0
1 5
2 0
2 5
K-means partitions comparison
Objects
Number of groups in each partition
2
3
4
5
6
7
8
9 10
5
1 0
1 5
2 0
2 5
0.06 0.10 0.14
ssi
criterion
Values
2
3
4
5
6
7
8
9 10
0.06 0.10 0.14
Fig. 4.20 k-means cascade plot showing the group attributed to each object for each partition
4.8 Non-hierarchical Clustering
99
together, insofar as possible, the objects pertaining to each group. A more
detailed explanation of this argument in provided in the function’s documentation
file.
The plot shows the group attributed to each object for each partition (rows of the
graph). The rows of the graph are the different values of k. The groups are
represented by different colours; there are two colours for k = 2, three colours for
k = 3, and so on. Another graph shows the values of the chosen stopping criterion
for the different values of k. Since this is an iterative process, the results can vary
from run to run.
How many groups does this cascade propose as the best solution? If one has
reasons to prefer a larger number of groups, what would be the next best
solution?
The function cascadeKM()provides numeric results as well. Among them, the
element ‘result’ gives the TESS statistic and the value of the criterion (calinski
or ssi) for each value of k. The element ‘partition’ contains a table showing the
group attributed to each object. If the geographic coordinates of the objects are
available, they can be used to plot a map of the objects, with symbols or colours
representing the groups specified by one of the columns of this table.
5
1 0
1 5
2 0
2 5
K-means partitions comparison
Objects
Number of groups in each partition
2
3
4
5
6
7
8
9 10
5
1 0
1 5
2 0
2 5
0.06 0.10 0.14
ssi
criterion
Values
2
3
4
5
6
7
8
9 10
0.06 0.10 0.14
Fig. 4.20 k-means cascade plot showing the group attributed to each object for each partition
4.8 Non-hierarchical Clustering
99