

The Maracaibo System, Venezuela
57
whereas artisanal and industrial trawling fisheries in the gulf produce
4,200 and 17,000 tons, respectively. Gulf fisheries are largely composed of
demersal marine fishes, the two most important species being pigfish
(Orthopristis ruber) and cutlassfish (Trachiurus lepturus). Seasonal
migrants into Tablazo Bay, like sabalo (Megalops atlanticus), sharks
(Mustelus spp.), snappers (Lutjanus spp.), and the croaker Micropogon furnieri account for 10% of the catch. Artisanal fisheries in the lake are composed of Micropogon furnieri (2,700 tons) and of estuarine species
(7,800tons) like catfishes which comprise the largest component (20%) of
the yield, followed by the "corvina dellago" ( Cynoscion maracaiboensis ),
mullets (Mugil spp.), and snooks (Centropomus spp.) . Freshwater fisheries
are important and haloxenic species like Potamorhina laticeps (manamana) and Prochilodus reticulatus (bocachico) yield 5,150 and 3,000 tons,
respectively. Invertebrates, especially several species of shrimp (Penaeus),
represent one of the most important fishery resources of the system, with a
yield of 3,000 tons in the gulf and 5,000 tons in the lake. Estuary fisheries of
the blue crab ( Callinectes sapidus) total2,000 tons and the clam Polymesoda salida is an important resource (Fig. 3.2).
A population in excess of 5.5 million and expanding agriculture and industry in the Maracaibo Basin have led to increasing freshwater demands
and decreasing freshwater quality during the last decades. Furthermore,
continuous dredging of almost 20% of the 360-km-long Maracaibo Channel, which represents a strategic waterway between the gulf and the lake for
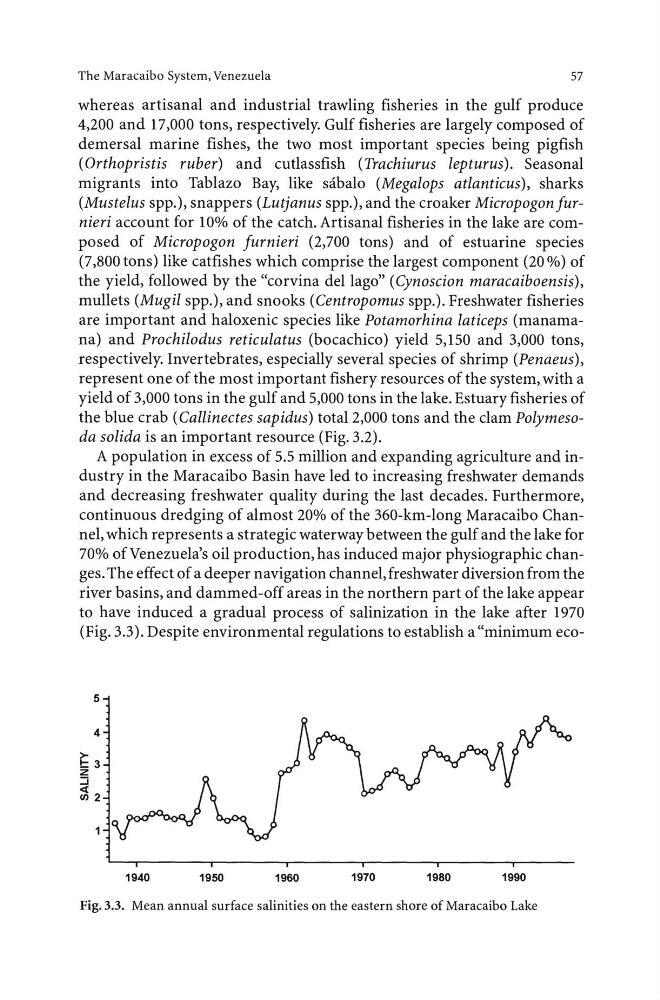
70% of Venezuela's oil production, has induced major physiographic changes. The effect of a deeper navigation channel, freshwater diversion from the
river basins, and dammed-off areas in the northern part of the lake appear
to have induced a gradual process of salinization in the lake after 1970
(Fig. 3.3). Despite environmental regulations to establish a "minimum eco5
4
>!:::3
z
:::i
<(
CIJ2
1940
1950
1960
1970
1980
1990
Fig. 3.3. Mean annual surface salinities on the eastern shore of Maracaibo Lake
57
whereas artisanal and industrial trawling fisheries in the gulf produce
4,200 and 17,000 tons, respectively. Gulf fisheries are largely composed of
demersal marine fishes, the two most important species being pigfish
(Orthopristis ruber) and cutlassfish (Trachiurus lepturus). Seasonal
migrants into Tablazo Bay, like sabalo (Megalops atlanticus), sharks
(Mustelus spp.), snappers (Lutjanus spp.), and the croaker Micropogon furnieri account for 10% of the catch. Artisanal fisheries in the lake are composed of Micropogon furnieri (2,700 tons) and of estuarine species
(7,800tons) like catfishes which comprise the largest component (20%) of
the yield, followed by the "corvina dellago" ( Cynoscion maracaiboensis ),
mullets (Mugil spp.), and snooks (Centropomus spp.) . Freshwater fisheries
are important and haloxenic species like Potamorhina laticeps (manamana) and Prochilodus reticulatus (bocachico) yield 5,150 and 3,000 tons,
respectively. Invertebrates, especially several species of shrimp (Penaeus),
represent one of the most important fishery resources of the system, with a
yield of 3,000 tons in the gulf and 5,000 tons in the lake. Estuary fisheries of
the blue crab ( Callinectes sapidus) total2,000 tons and the clam Polymesoda salida is an important resource (Fig. 3.2).
A population in excess of 5.5 million and expanding agriculture and industry in the Maracaibo Basin have led to increasing freshwater demands
and decreasing freshwater quality during the last decades. Furthermore,
continuous dredging of almost 20% of the 360-km-long Maracaibo Channel, which represents a strategic waterway between the gulf and the lake for
70% of Venezuela's oil production, has induced major physiographic changes. The effect of a deeper navigation channel, freshwater diversion from the
river basins, and dammed-off areas in the northern part of the lake appear
to have induced a gradual process of salinization in the lake after 1970
(Fig. 3.3). Despite environmental regulations to establish a "minimum eco5
4
>!:::3
z
:::i
<(
CIJ2
1940
1950
1960
1970
1980
1990
Fig. 3.3. Mean annual surface salinities on the eastern shore of Maracaibo Lake