

2. Factors Controlling the Climate of the West Coast of North America 31
North Coastal Region Monthly Precipitation
§ . . . - - - - - - - - - - - - ,
§
' H
Jan Feb MIt I4IfI May Jun J" Aug S8p Ocl Nov Dec
South Coastal Region Monthly Preclpltatlon
§.------------.
§
I §
~ ~
~
Jan Fib MIT I4IfI MayJun JuI Aug S8p Ocl Nov Dec
InIIr-q1llltile IMQllII end median areIhown
Inlar-quartile rangee andrnecIan arear-n
~
~
I
~
I
I I I , I , I
~
I
,
~
w w w
~
South Interior Region Monthly Precipitation
~
North Interior Region Monthly Precipitation
~.--------------,
~
~
':' ~
':'
fIl
~
':'
lil
I
I
6
51
! I , I
Ii!
.,.
=
I I ~ I
E 0
Ii
I
...
•
;
iii
w
~
lil
w
w
~
W
0
0
Jan Feb Mil' ,." May Jun J" Aug S8p Ocl Nov Dec
Jill Feb MIT ,." May Jun JuI Aug Sap Ocl Nov Dec
1nItr-q..rtIIe rangee end median lTear-n
In...-quartlle rangea end rnecIan nlhown
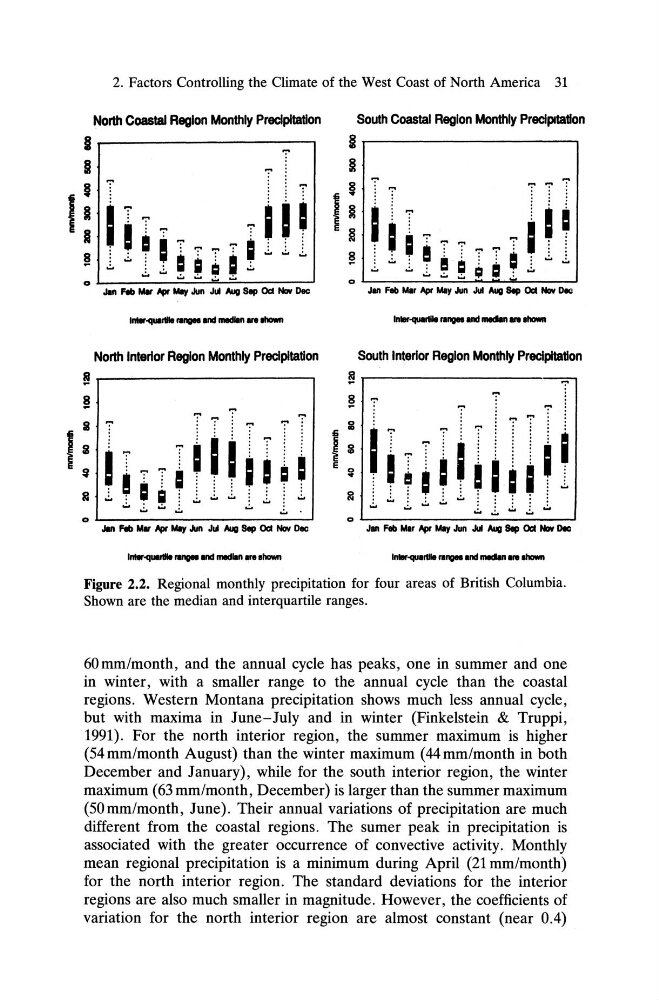
Figure 2.2. Regional monthly precipitation for four areas of British Columbia.
Shown are the median and interquartile ranges.
60 mm/month, and the annual cycle has peaks, one in summer and one
in winter, with a smaller range to the annual cycle than the coastal
regions. Western Montana precipitation shows much less annual cycle,
but with maxima in June-July and in winter (Finkelstein & Truppi,
1991) . For the north interior region, the summer maximum is higher
(54mm/month August) than the winter maximum (44mm/month in both
December and January), while for the south interior region, the winter
maximum (63mm/month, December) is larger than the summer maximum
(50 mm/month, June). Their annual variations of precipitation are much
different from the coastal regions. The sumer peak in precipitation is
associated with the greater occurrence of convective activity. Monthly
mean regional precipitation is a minimum during April (21 mm/month)
for the north interior region. The standard deviations for the interior
regions are also much smaller in magnitude. However, the coefficients of
variation for the north interior region are almost constant (near 0.4)
North Coastal Region Monthly Precipitation
§ . . . - - - - - - - - - - - - ,
§
' H
Jan Feb MIt I4IfI May Jun J" Aug S8p Ocl Nov Dec
South Coastal Region Monthly Preclpltatlon
§.------------.
§
I §
~ ~
~
Jan Fib MIT I4IfI MayJun JuI Aug S8p Ocl Nov Dec
InIIr-q1llltile IMQllII end median areIhown
Inlar-quartile rangee andrnecIan arear-n
~
~
I
~
I
I I I , I , I
~
I
,
~
w w w
~
South Interior Region Monthly Precipitation
~
North Interior Region Monthly Precipitation
~.--------------,
~
~
':' ~
':'
fIl
~
':'
lil
I
I
6
51
! I , I
Ii!
.,.
=
I I ~ I
E 0
Ii
I
...
•
;
iii
w
~
lil
w
w
~
W
0
0
Jan Feb Mil' ,." May Jun J" Aug S8p Ocl Nov Dec
Jill Feb MIT ,." May Jun JuI Aug Sap Ocl Nov Dec
1nItr-q..rtIIe rangee end median lTear-n
In...-quartlle rangea end rnecIan nlhown
Figure 2.2. Regional monthly precipitation for four areas of British Columbia.
Shown are the median and interquartile ranges.
60 mm/month, and the annual cycle has peaks, one in summer and one
in winter, with a smaller range to the annual cycle than the coastal
regions. Western Montana precipitation shows much less annual cycle,
but with maxima in June-July and in winter (Finkelstein & Truppi,
1991) . For the north interior region, the summer maximum is higher
(54mm/month August) than the winter maximum (44mm/month in both
December and January), while for the south interior region, the winter
maximum (63mm/month, December) is larger than the summer maximum
(50 mm/month, June). Their annual variations of precipitation are much
different from the coastal regions. The sumer peak in precipitation is
associated with the greater occurrence of convective activity. Monthly
mean regional precipitation is a minimum during April (21 mm/month)
for the north interior region. The standard deviations for the interior
regions are also much smaller in magnitude. However, the coefficients of
variation for the north interior region are almost constant (near 0.4)