

2. Factors Controlling the Climate of the West Coast of North America 29
1993), is like weather prediction , except the predicted states are given in
a statistical sense (warmer than normal, wetter, etc.) rather than as a
sequence of synoptic weather conditions. The emphasis of climate prediction has been on seasonal-to-interannual time scales. Examination oflong
time series of climatic characteristics reveals a dominant signal associated
with the El Nino-Southern Oscillation, the coupling of the tropical
Pacific atmosphere and ocean with global climatic implications.
Within the climate system, the statistical impacts of shorter time-scale
phenomena may be reflected in slow variations in other characteristics.
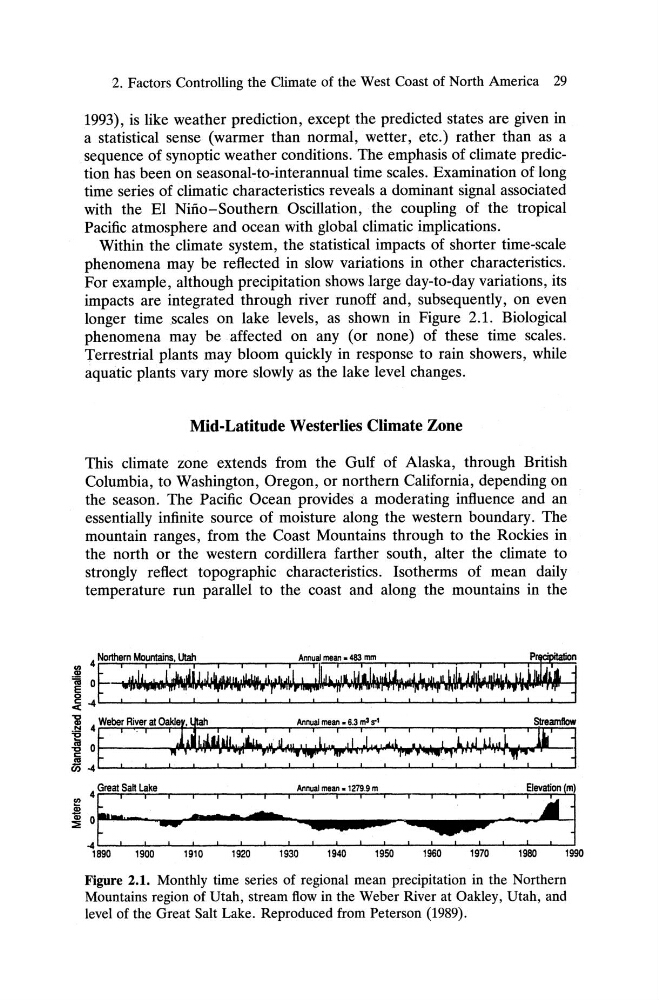
For example, although precipitation shows large day-to-day variations, its
impacts are integrated through river runoff and, subsequently, on even
longer time scales on lake levels, as shown in Figure 2.1. Biological
phenomena may be affected on any (or none) of these time scales.
Terrestrial plants may bloom quickly in response to rain showers, while
aquatic plants vary more slowly as the lake level changes.
Mid-Latitude Westerlies Climate Zone
This climate zone extends from the Gulf of Alaska, through British
Columbia, to Washington, Oregon, or northern California, depending on
the season. The Pacific Ocean provides a moderating influence and an
essentially infinite source of moisture along the western boundary. The
mountain ranges, from the Coast Mountains through to the Rockies in
the north or the western cordillera farther south , alter the climate to
strongly reflect topographic characteristics. Isotherms of mean daily
temperature run parallel to the coast and along the mountains in the
4 Northern Mountains. Utah
Annual mean.483 mm
~
i ~E ~~~~I~~~i~~II'~I~~
<
~ 4 Weber River at0akI~.
Annual mean.6.3 m3 ..'
Streamftow
i 0t : ;: ~u~"~~~~v~1,~~:jl":~~~~1 :L,~U,,~L", ~ ~
a
I t ' ' r·
,,..-'11 ~ f ' • •
.,
~., ",F ",.
en-4
.
! ~E~~-: ::- : :' :~~~'~. .::;;u: : - ;~
1890
1900
1910
1920
1930
1940
1950
1960
1970
1980
1990
Figure 2.1. Monthly time series of regional mean precipitation in the Northern
Mountains region of Utah, stream flow in the Weber River at Oakley, Utah, and
level of the Great Salt Lake . Reproduced from Peterson (1989) .
1993), is like weather prediction , except the predicted states are given in
a statistical sense (warmer than normal, wetter, etc.) rather than as a
sequence of synoptic weather conditions. The emphasis of climate prediction has been on seasonal-to-interannual time scales. Examination oflong
time series of climatic characteristics reveals a dominant signal associated
with the El Nino-Southern Oscillation, the coupling of the tropical
Pacific atmosphere and ocean with global climatic implications.
Within the climate system, the statistical impacts of shorter time-scale
phenomena may be reflected in slow variations in other characteristics.
For example, although precipitation shows large day-to-day variations, its
impacts are integrated through river runoff and, subsequently, on even
longer time scales on lake levels, as shown in Figure 2.1. Biological
phenomena may be affected on any (or none) of these time scales.
Terrestrial plants may bloom quickly in response to rain showers, while
aquatic plants vary more slowly as the lake level changes.
Mid-Latitude Westerlies Climate Zone
This climate zone extends from the Gulf of Alaska, through British
Columbia, to Washington, Oregon, or northern California, depending on
the season. The Pacific Ocean provides a moderating influence and an
essentially infinite source of moisture along the western boundary. The
mountain ranges, from the Coast Mountains through to the Rockies in
the north or the western cordillera farther south , alter the climate to
strongly reflect topographic characteristics. Isotherms of mean daily
temperature run parallel to the coast and along the mountains in the
4 Northern Mountains. Utah
Annual mean.483 mm
~
i ~E ~~~~I~~~i~~II'~I~~
<
~ 4 Weber River at0akI~.
Annual mean.6.3 m3 ..'
Streamftow
i 0t : ;: ~u~"~~~~v~1,~~:jl":~~~~1 :L,~U,,~L", ~ ~
a
I t ' ' r·
,,..-'11 ~ f ' • •
.,
~., ",F ",.
en-4
.
! ~E~~-: ::- : :' :~~~'~. .::;;u: : - ;~
1890
1900
1910
1920
1930
1940
1950
1960
1970
1980
1990
Figure 2.1. Monthly time series of regional mean precipitation in the Northern
Mountains region of Utah, stream flow in the Weber River at Oakley, Utah, and
level of the Great Salt Lake . Reproduced from Peterson (1989) .