

20
R.G. Lawford
200.0
2000 E
180.0
SOJ
E 160.0
1600 ""0
C's
15
140.0
1400 (5
til
c 120.0
1200 C
:J
a: 100.0
OJ
til
1000 c
:J
80.0
800
E
c
0
c
0
~
60.0
600
B
c
CIl
40.0
400
OJ
OJ
0
:2
c
20.0
200
CIl
iii
0.0
0
(5
-55 -45 -35 -25 -15 -5 5 15 25 35 45 55 65
Degrees of Latitude
1 _ Discharge (km3) - - Dist. to Cont. Div.
I
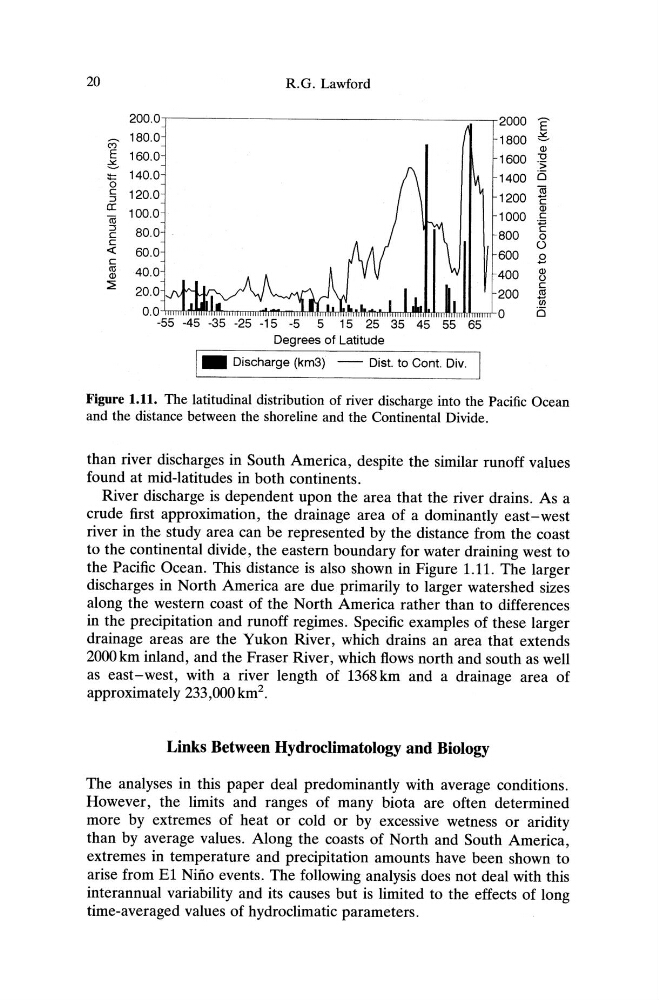
Figure 1.11. The latitudinal distribution of river discharge into the Pacific Ocean
and the distance between the shoreline and the Continental Divide.
than river discharges in South America, despite the similar runoff values
found at mid-latitudes in both continents.
River discharge is dependent upon the area that the river drains. As a
crude first approximation, the drainage area of a dominantly east-west
river in the study area can be represented by the distance from the coast
to the continental divide, the eastern boundary for water draining west to
the Pacific Ocean. This distance is also shown in Figure 1.11. The larger
discharges in North America are due primarily to larger watershed sizes
along the western coast of the North America rather than to differences
in the precipitation and runoff regimes. Specific examples of these larger
drainage areas are the Yukon River, which drains an area that extends
2000km inland, and the Fraser River, which flows north and south as well
as east-west, with a river length of 1368km and a drainage area of
approximately 233,OOOkm
2 •
Links Between Hydroclimatology an d Biology
The analyses in this paper deal predominantly with average conditions.
However, the limits and ranges of man y biota are often determined
more by extremes of heat or cold or by excessive wetness or aridity
than by average values. Along the coasts of North and South America,
extremes in temperature and precipitation amounts have been shown to
arise from E1 Nino events. The following analysis does not deal with this
interannual variability and its causes but is limited to the effects of long
time-averaged values of hydroclimatic parameters.
R.G. Lawford
200.0
2000 E
180.0
SOJ
E 160.0
1600 ""0
C's
15
140.0
1400 (5
til
c 120.0
1200 C
:J
a: 100.0
OJ
til
1000 c
:J
80.0
800
E
c
0
c
0
~
60.0
600
B
c
CIl
40.0
400
OJ
OJ
0
:2
c
20.0
200
CIl
iii
0.0
0
(5
-55 -45 -35 -25 -15 -5 5 15 25 35 45 55 65
Degrees of Latitude
1 _ Discharge (km3) - - Dist. to Cont. Div.
I
Figure 1.11. The latitudinal distribution of river discharge into the Pacific Ocean
and the distance between the shoreline and the Continental Divide.
than river discharges in South America, despite the similar runoff values
found at mid-latitudes in both continents.
River discharge is dependent upon the area that the river drains. As a
crude first approximation, the drainage area of a dominantly east-west
river in the study area can be represented by the distance from the coast
to the continental divide, the eastern boundary for water draining west to
the Pacific Ocean. This distance is also shown in Figure 1.11. The larger
discharges in North America are due primarily to larger watershed sizes
along the western coast of the North America rather than to differences
in the precipitation and runoff regimes. Specific examples of these larger
drainage areas are the Yukon River, which drains an area that extends
2000km inland, and the Fraser River, which flows north and south as well
as east-west, with a river length of 1368km and a drainage area of
approximately 233,OOOkm
2 •
Links Between Hydroclimatology an d Biology
The analyses in this paper deal predominantly with average conditions.
However, the limits and ranges of man y biota are often determined
more by extremes of heat or cold or by excessive wetness or aridity
than by average values. Along the coasts of North and South America,
extremes in temperature and precipitation amounts have been shown to
arise from E1 Nino events. The following analysis does not deal with this
interannual variability and its causes but is limited to the effects of long
time-averaged values of hydroclimatic parameters.