

14. Patch Dynamics for Forested Ecosystems in the Pacific Northwest
293
0.20
20
0.10
"' ""'
E
.,
0.00
"0
u
(/)
10
-0.10
-0.20
Lag (m)
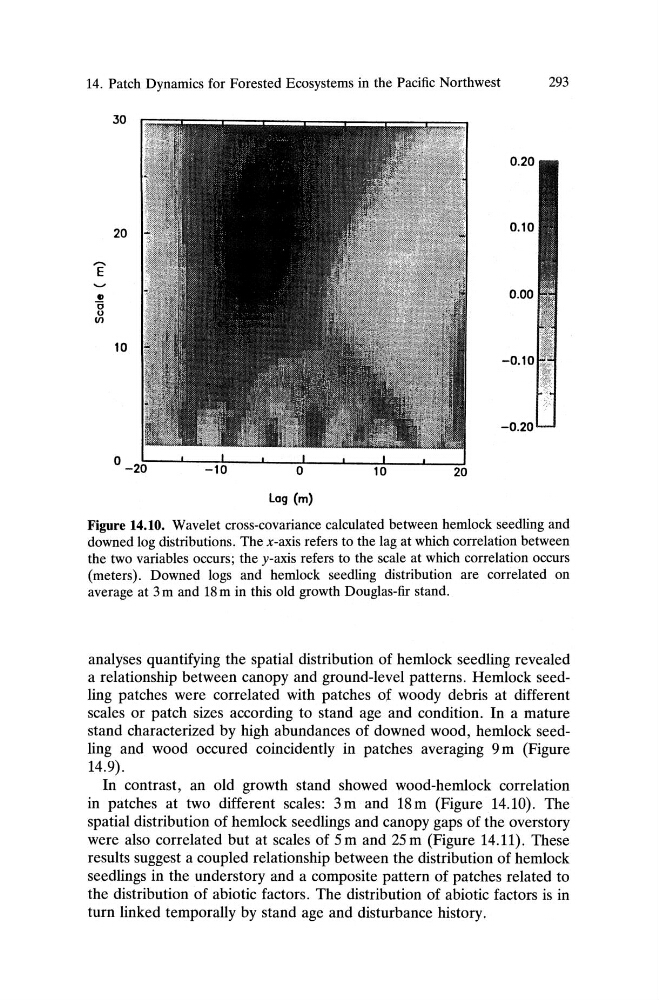
Figure 14.10. Wavelet cross-covariance calculated between hemlock seedling and
downed log distributions . The x-axis refers to the lag at which correlation between
the two variables occurs; the y-axis refers to the scale at which correlation occurs
(meters). Downed logs and hemlock seedling distribution are correlated on
average at 3 m and 18m in this old growth Douglas-fir stand.
analyses quantifying the spatial distribution of hemlock seedling revealed
a relationship between canopy and ground-level patterns. Hemlock seedling patches were correlated with patches of woody debris at different
scales or patch sizes according to stand age and condition. In a mature
stand characterized by high abundances of downed wood, hemlock seedling and wood occured coincidently in patches averaging 9 m (Figure
14.9).
In contrast, an old growth stand showed wood-hemlock correlation
in patches at two different scales: 3 m and 18m (Figure 14.10). The
spatial distribution of hemlock seedlings and canopy gaps of the overstory
were also correlated but at scales of 5 m and 25 m (Figure 14.11). These
results suggest a coupled relationship between the distribution of hemlock
seedlings in the understory and a composite pattern of patches related to
the distribution of abiotic factors . The distribution of abiotic factors is in
turn linked temporally by stand age and disturbance history .
293
0.20
20
0.10
"' ""'
E
.,
0.00
"0
u
(/)
10
-0.10
-0.20
Lag (m)
Figure 14.10. Wavelet cross-covariance calculated between hemlock seedling and
downed log distributions . The x-axis refers to the lag at which correlation between
the two variables occurs; the y-axis refers to the scale at which correlation occurs
(meters). Downed logs and hemlock seedling distribution are correlated on
average at 3 m and 18m in this old growth Douglas-fir stand.
analyses quantifying the spatial distribution of hemlock seedling revealed
a relationship between canopy and ground-level patterns. Hemlock seedling patches were correlated with patches of woody debris at different
scales or patch sizes according to stand age and condition. In a mature
stand characterized by high abundances of downed wood, hemlock seedling and wood occured coincidently in patches averaging 9 m (Figure
14.9).
In contrast, an old growth stand showed wood-hemlock correlation
in patches at two different scales: 3 m and 18m (Figure 14.10). The
spatial distribution of hemlock seedlings and canopy gaps of the overstory
were also correlated but at scales of 5 m and 25 m (Figure 14.11). These
results suggest a coupled relationship between the distribution of hemlock
seedlings in the understory and a composite pattern of patches related to
the distribution of abiotic factors . The distribution of abiotic factors is in
turn linked temporally by stand age and disturbance history .