

14. Patch Dynamics for Forested Ecosystems in the Pacific Northwest
291
topographic factors when a threshold slope grade is exceeded (Figure
14.7).
These relationships may be viewed within the landscape context. A set
of stand condition maps were created based on Thematic Mapper satellite
imagery, classified according to age and structure. Companion elevational
maps were developed for the Douglas fir dominant forest in the H.J .
Andrews Experimental Forest located in central Oregon (Fiorella &
Ripple, 1992). Old-growth Douglas-fir dominant stands characterized on
average by moderate-to-large gaps were overlaid on slope and aspect
maps derived from the topographic GIS coverage. The intersection of
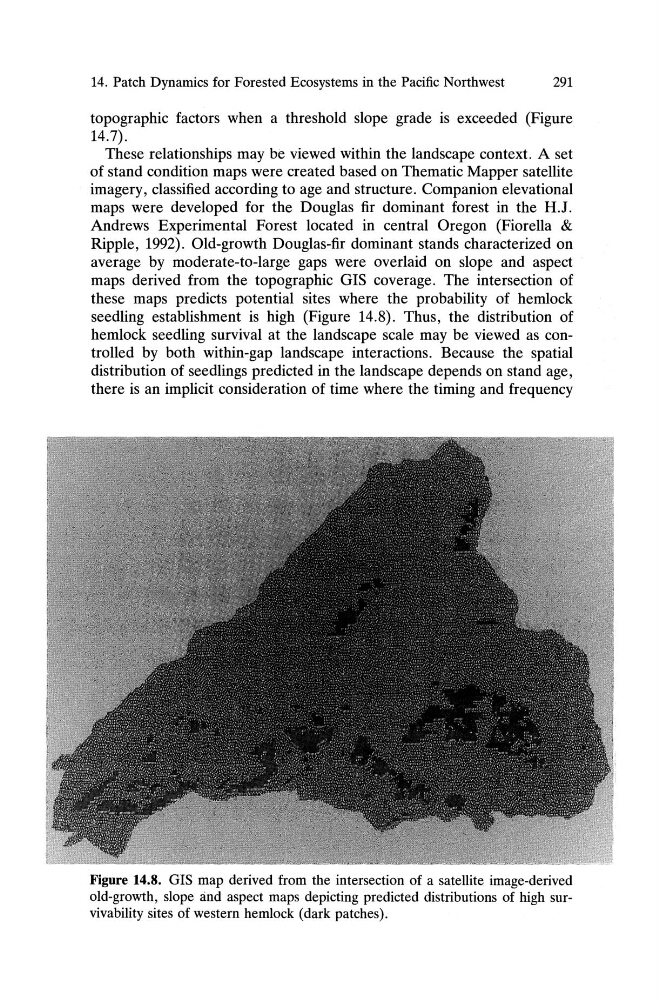
these maps predicts potential sites where the probability of hemlock
seedling establishment is high (Figure 14.8). Thus, the distribution of
hemlock seedling survival at the landscape scale may be viewed as controlled by both within-gap landscape interactions. Because the spatial
distribution of seedlings predicted in the landscape depends on stand age,
there is an implicit consideration of time where the timing and frequency
Figure 14.8. GIS map derived from the intersection of a satellite image-derived
old-growth, slope and aspect maps depicting predicted distributions of high survivability sites of western hemlock (dark patches) .
291
topographic factors when a threshold slope grade is exceeded (Figure
14.7).
These relationships may be viewed within the landscape context. A set
of stand condition maps were created based on Thematic Mapper satellite
imagery, classified according to age and structure. Companion elevational
maps were developed for the Douglas fir dominant forest in the H.J .
Andrews Experimental Forest located in central Oregon (Fiorella &
Ripple, 1992). Old-growth Douglas-fir dominant stands characterized on
average by moderate-to-large gaps were overlaid on slope and aspect
maps derived from the topographic GIS coverage. The intersection of
these maps predicts potential sites where the probability of hemlock
seedling establishment is high (Figure 14.8). Thus, the distribution of
hemlock seedling survival at the landscape scale may be viewed as controlled by both within-gap landscape interactions. Because the spatial
distribution of seedlings predicted in the landscape depends on stand age,
there is an implicit consideration of time where the timing and frequency
Figure 14.8. GIS map derived from the intersection of a satellite image-derived
old-growth, slope and aspect maps depicting predicted distributions of high survivability sites of western hemlock (dark patches) .