

1. North-South Variations in West Coast Hydrometeorological Parameters
7
Table 1.1. Data U sed in this Study
Parameter
Temperature
Elevation
Precipitation
Runoff
Sensible Heat
Flux
Latent Heat
Flux
Net Radiation
Data Source
Climatic Atlas of North and
Central America; Climatic
Atlas of South America
U.S . Military Series of World
Maps
Climatic Atlas of North and
Central America; Climatic
Atlas of South America
World Water Resources Atlas
(L'vovich, 1979); Atlas of
World Water Balance
(Korzun et aI., 1978);
Surface Energy Balance
(Henning, 1989)
Henning (1989)
Henning (1989)
Henning (1989)
Types of Averages
Coastal transect, averages
more than 100 km
Coastal transect, averages
more than 100 km
Coastal transect, averages
more than 100 km
Averages for the coast
Averages for each latitude
in the study zone
Averages for each latitude
in the study zone
Averages for each latitude
in the study zone
balance computations, internal consistency between the parameters was
not guaranteed for the study zone, since several data sources were used.
Energy fluxes and precipitation patterns were obtained from Henning
(1989), who used surface climatological measurements to derive a set of
global and continental maps showing all components ofthe surface energy
and water cycles. Maps of the global water cycle produced by L'vovich
(1979) and Korzun et al. (1978) were also used to derive the values of
individual parameters along the coast.
Methodology
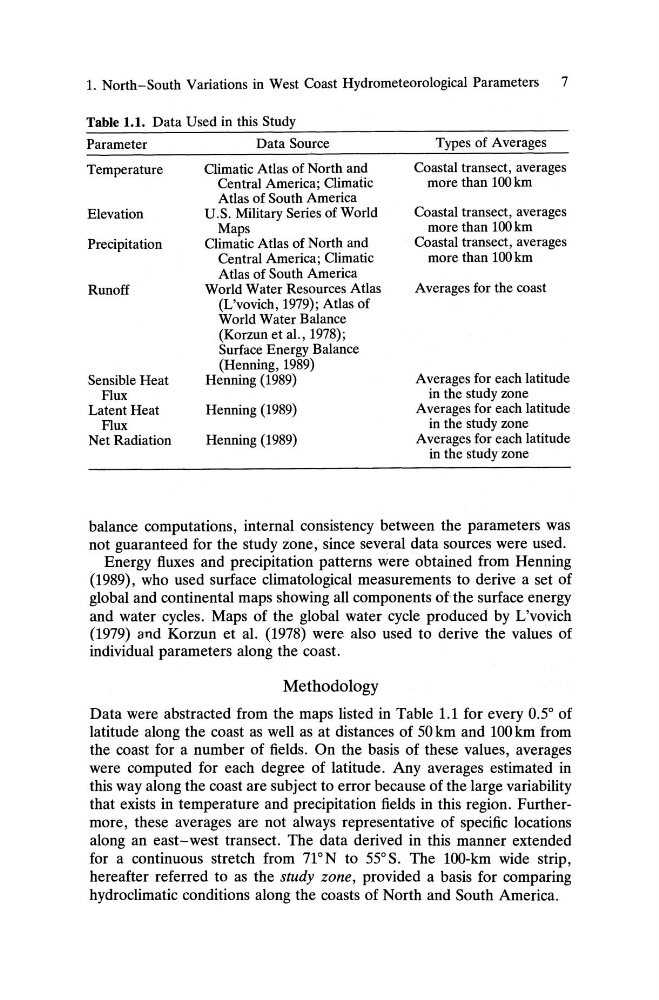
Data were abstracted from the maps listed in Table 1.1 for every OS of
latitude along the coast as well as at distances of 50 km and 100km from
the coast for a number of fields. On the basis of these values, averages
were computed for each degree of latitude. Any averages estimated in
this way along the coast are subject to error because of the large variability
that exists in temperature and precipitation fields in this region. Furthermore , these averages are not always representative of specific locations
along an east-west transect. The data derived in this manner extended
for a continuous stretch from nON to 55°S. The 100-km wide strip ,
hereafter referred to as the study zone, provided a basis for comparing
hydroclimatic conditions along the coasts of North and South America.
7
Table 1.1. Data U sed in this Study
Parameter
Temperature
Elevation
Precipitation
Runoff
Sensible Heat
Flux
Latent Heat
Flux
Net Radiation
Data Source
Climatic Atlas of North and
Central America; Climatic
Atlas of South America
U.S . Military Series of World
Maps
Climatic Atlas of North and
Central America; Climatic
Atlas of South America
World Water Resources Atlas
(L'vovich, 1979); Atlas of
World Water Balance
(Korzun et aI., 1978);
Surface Energy Balance
(Henning, 1989)
Henning (1989)
Henning (1989)
Henning (1989)
Types of Averages
Coastal transect, averages
more than 100 km
Coastal transect, averages
more than 100 km
Coastal transect, averages
more than 100 km
Averages for the coast
Averages for each latitude
in the study zone
Averages for each latitude
in the study zone
Averages for each latitude
in the study zone
balance computations, internal consistency between the parameters was
not guaranteed for the study zone, since several data sources were used.
Energy fluxes and precipitation patterns were obtained from Henning
(1989), who used surface climatological measurements to derive a set of
global and continental maps showing all components ofthe surface energy
and water cycles. Maps of the global water cycle produced by L'vovich
(1979) and Korzun et al. (1978) were also used to derive the values of
individual parameters along the coast.
Methodology
Data were abstracted from the maps listed in Table 1.1 for every OS of
latitude along the coast as well as at distances of 50 km and 100km from
the coast for a number of fields. On the basis of these values, averages
were computed for each degree of latitude. Any averages estimated in
this way along the coast are subject to error because of the large variability
that exists in temperature and precipitation fields in this region. Furthermore , these averages are not always representative of specific locations
along an east-west transect. The data derived in this manner extended
for a continuous stretch from nON to 55°S. The 100-km wide strip ,
hereafter referred to as the study zone, provided a basis for comparing
hydroclimatic conditions along the coasts of North and South America.